During my last year at UC San Diego, I took a design class (DSGN 100) in which I was introduced to practices of interaction design with a focus on visual and digital prototyping. I gained amazing insight about design from my peers, classmates, and instructors. Though the entirety of the class was held over Zoom due to the pandemic, I really enjoyed learning about design, which is so important and relevant in our every day lives. Below, I've included two projects that I worked on during the class.
Poster Design (April 2020)
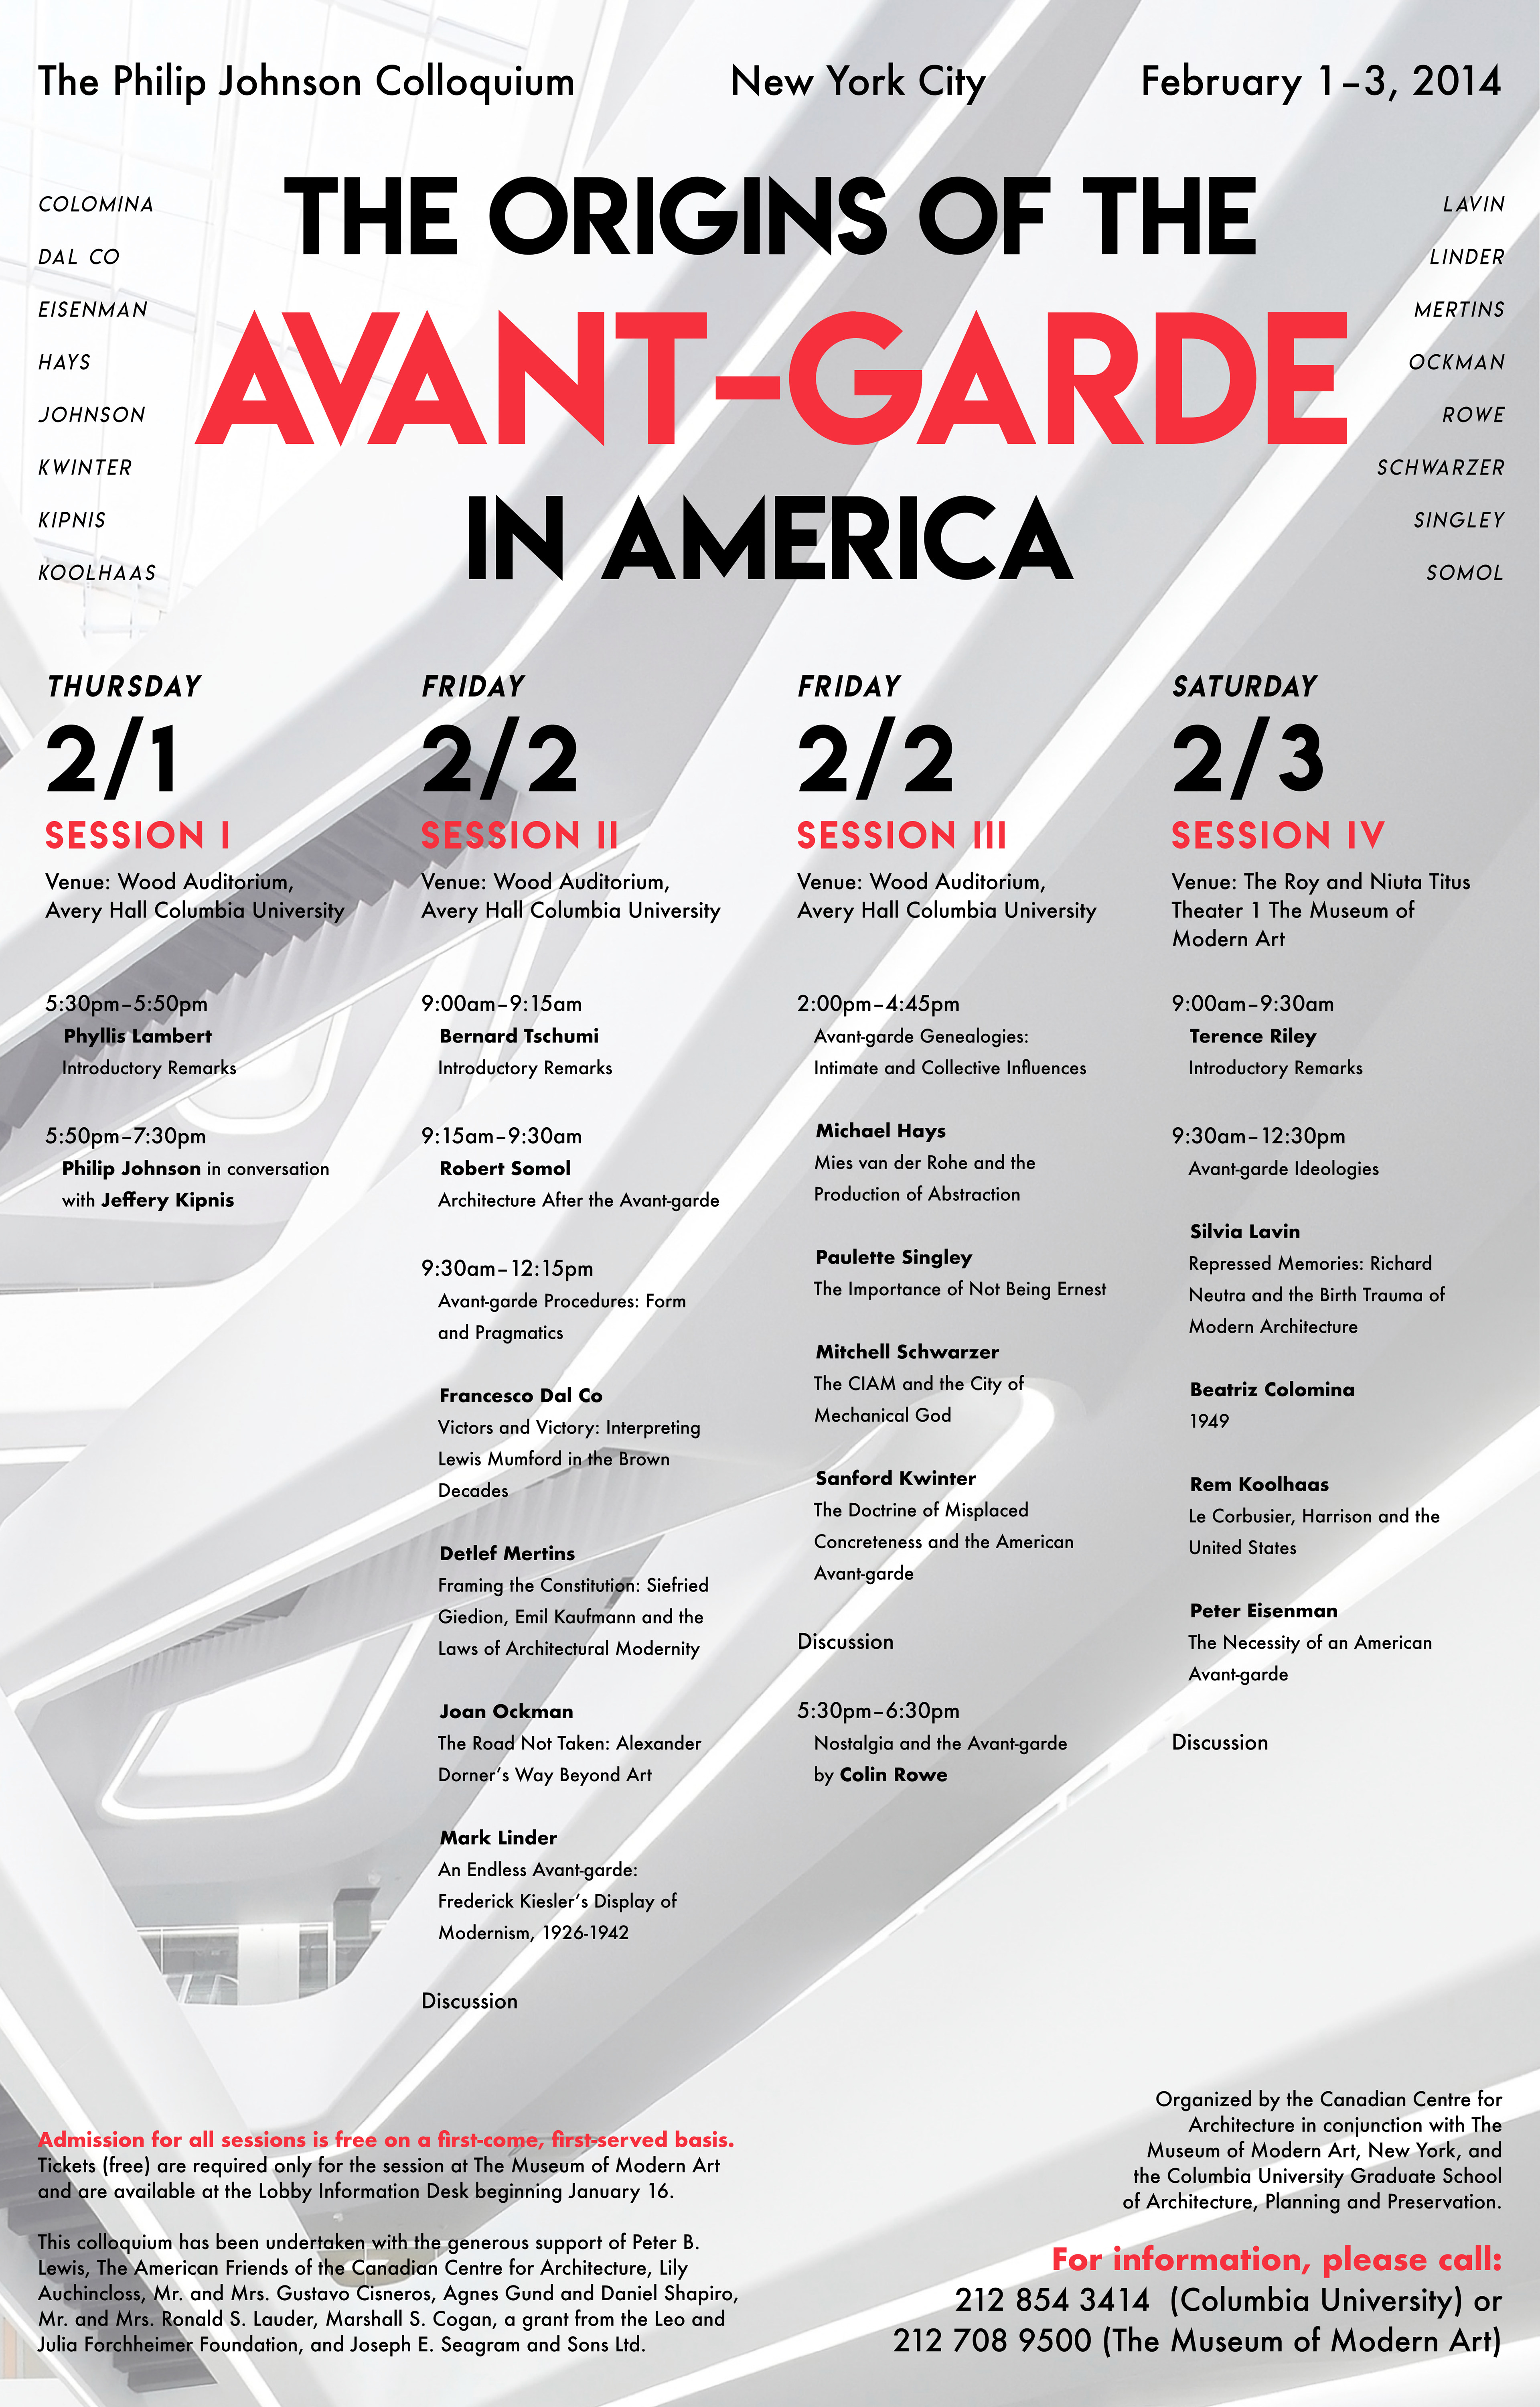
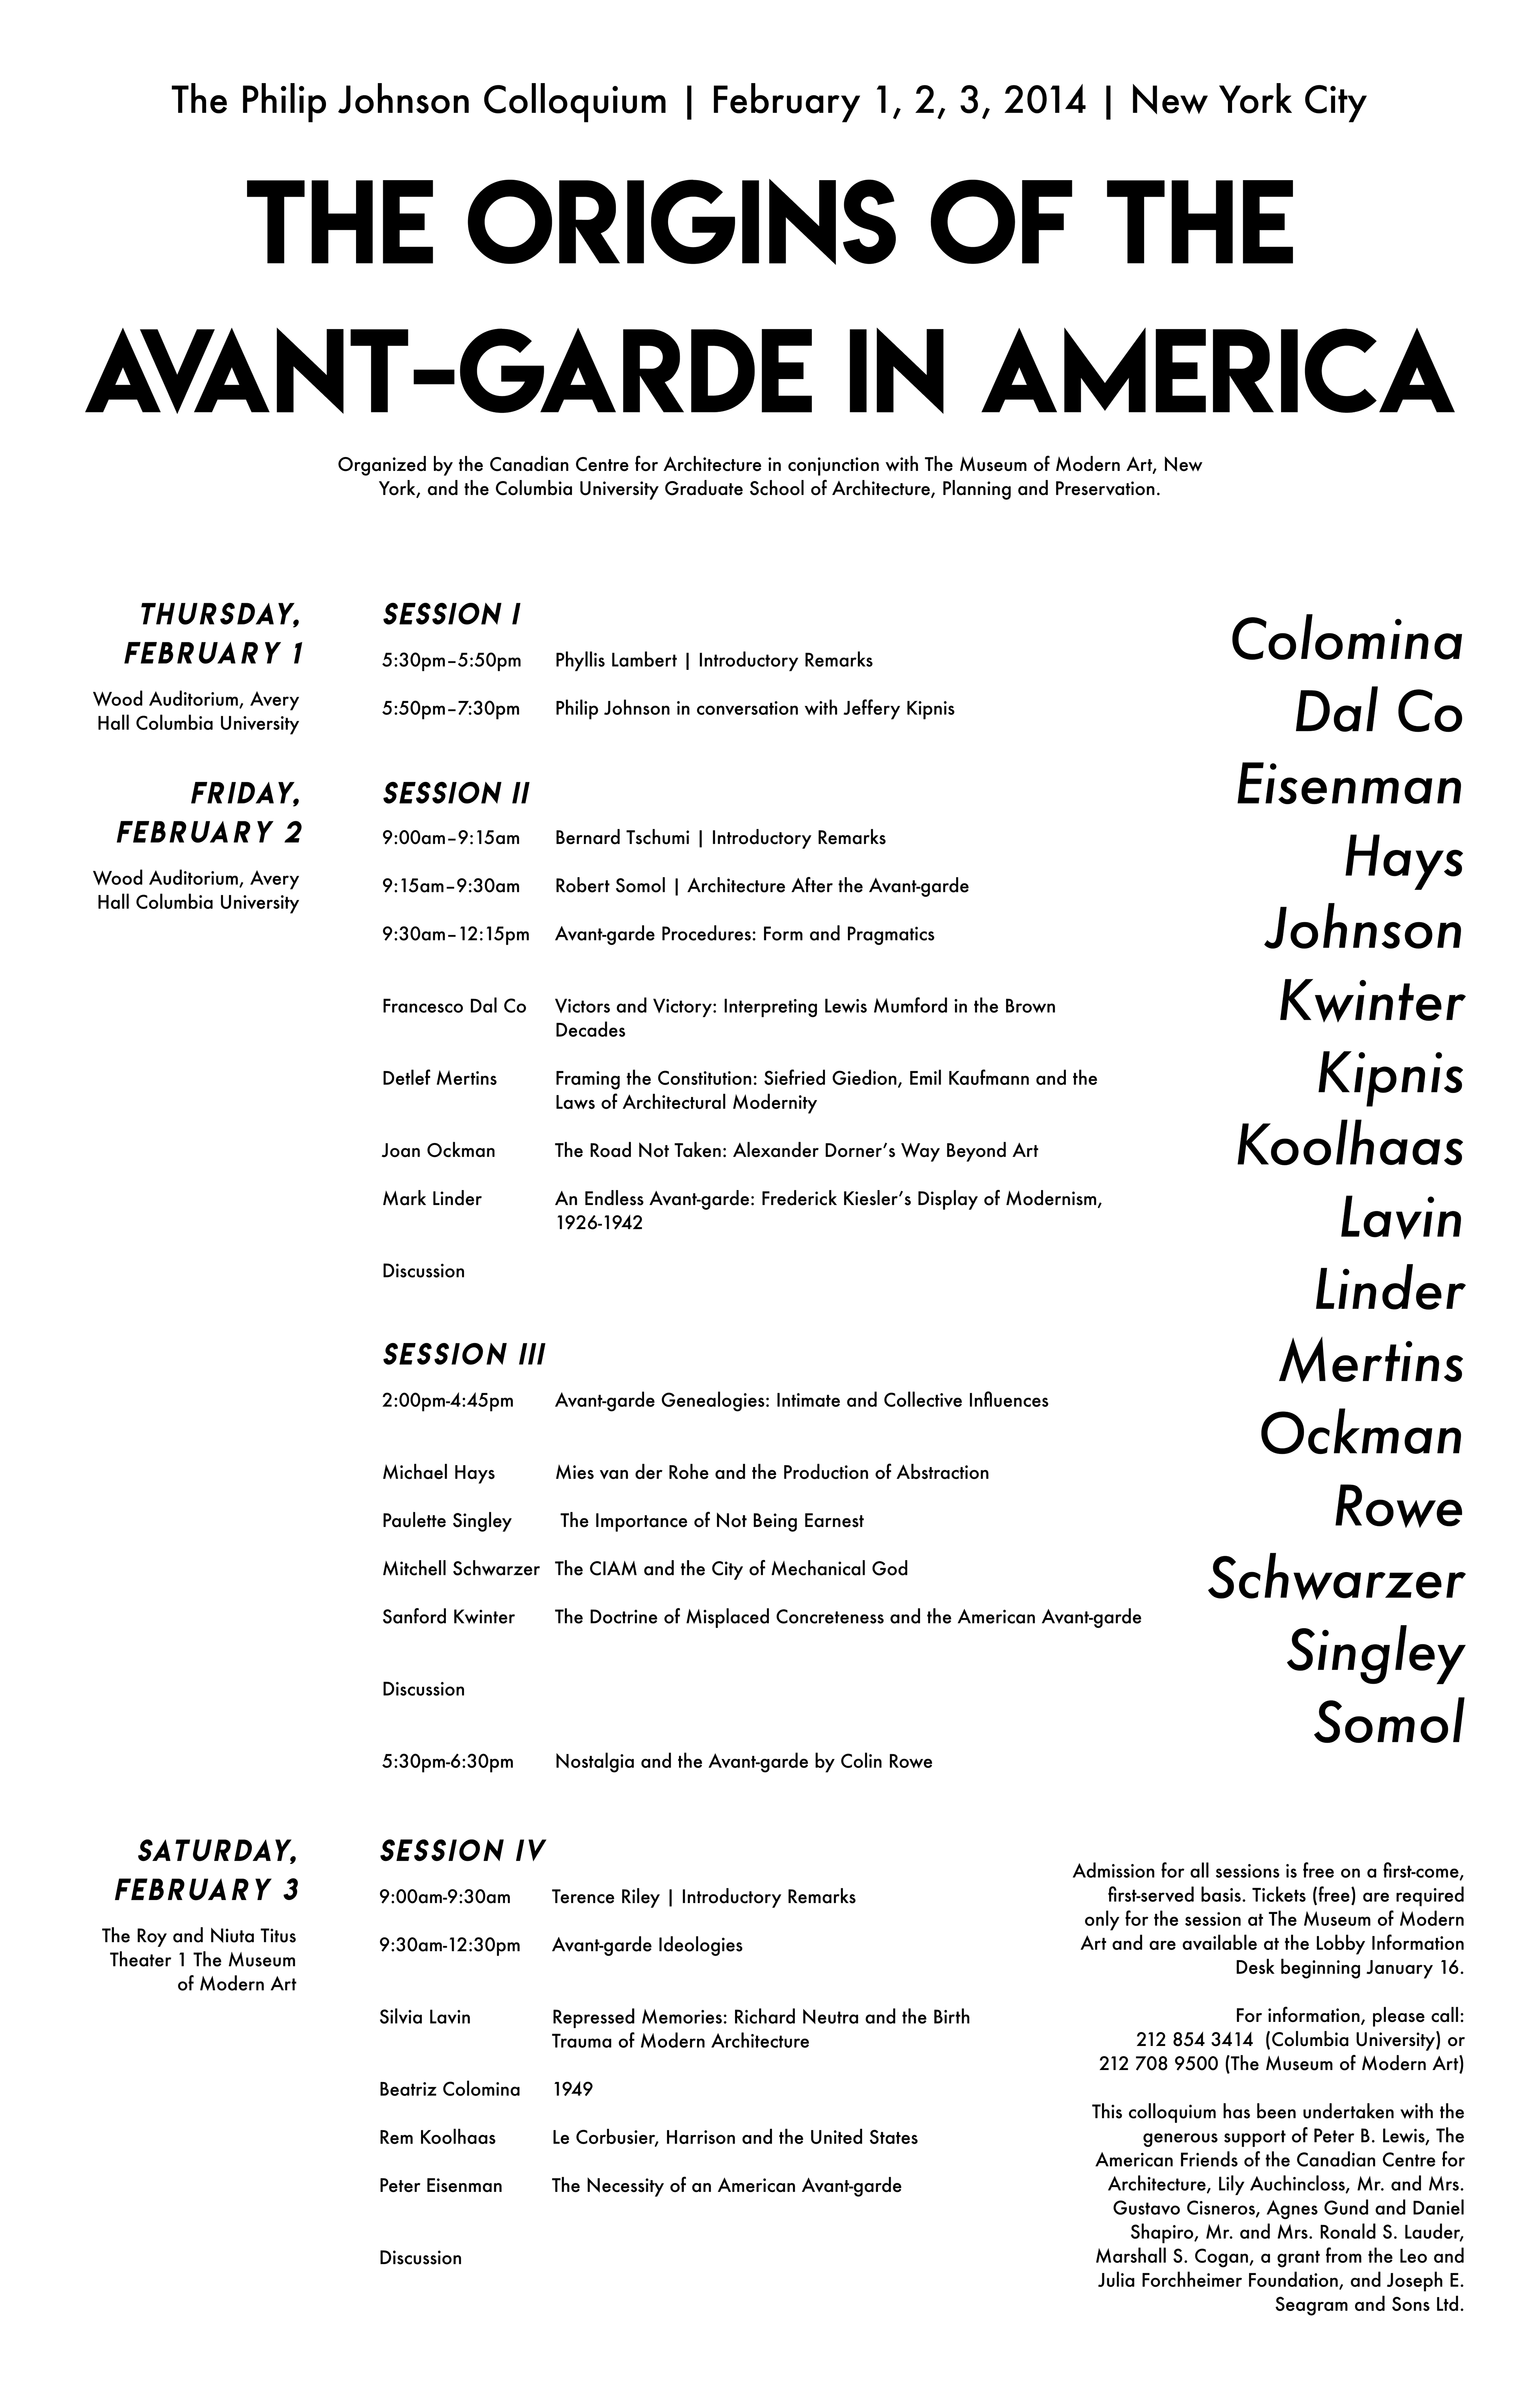
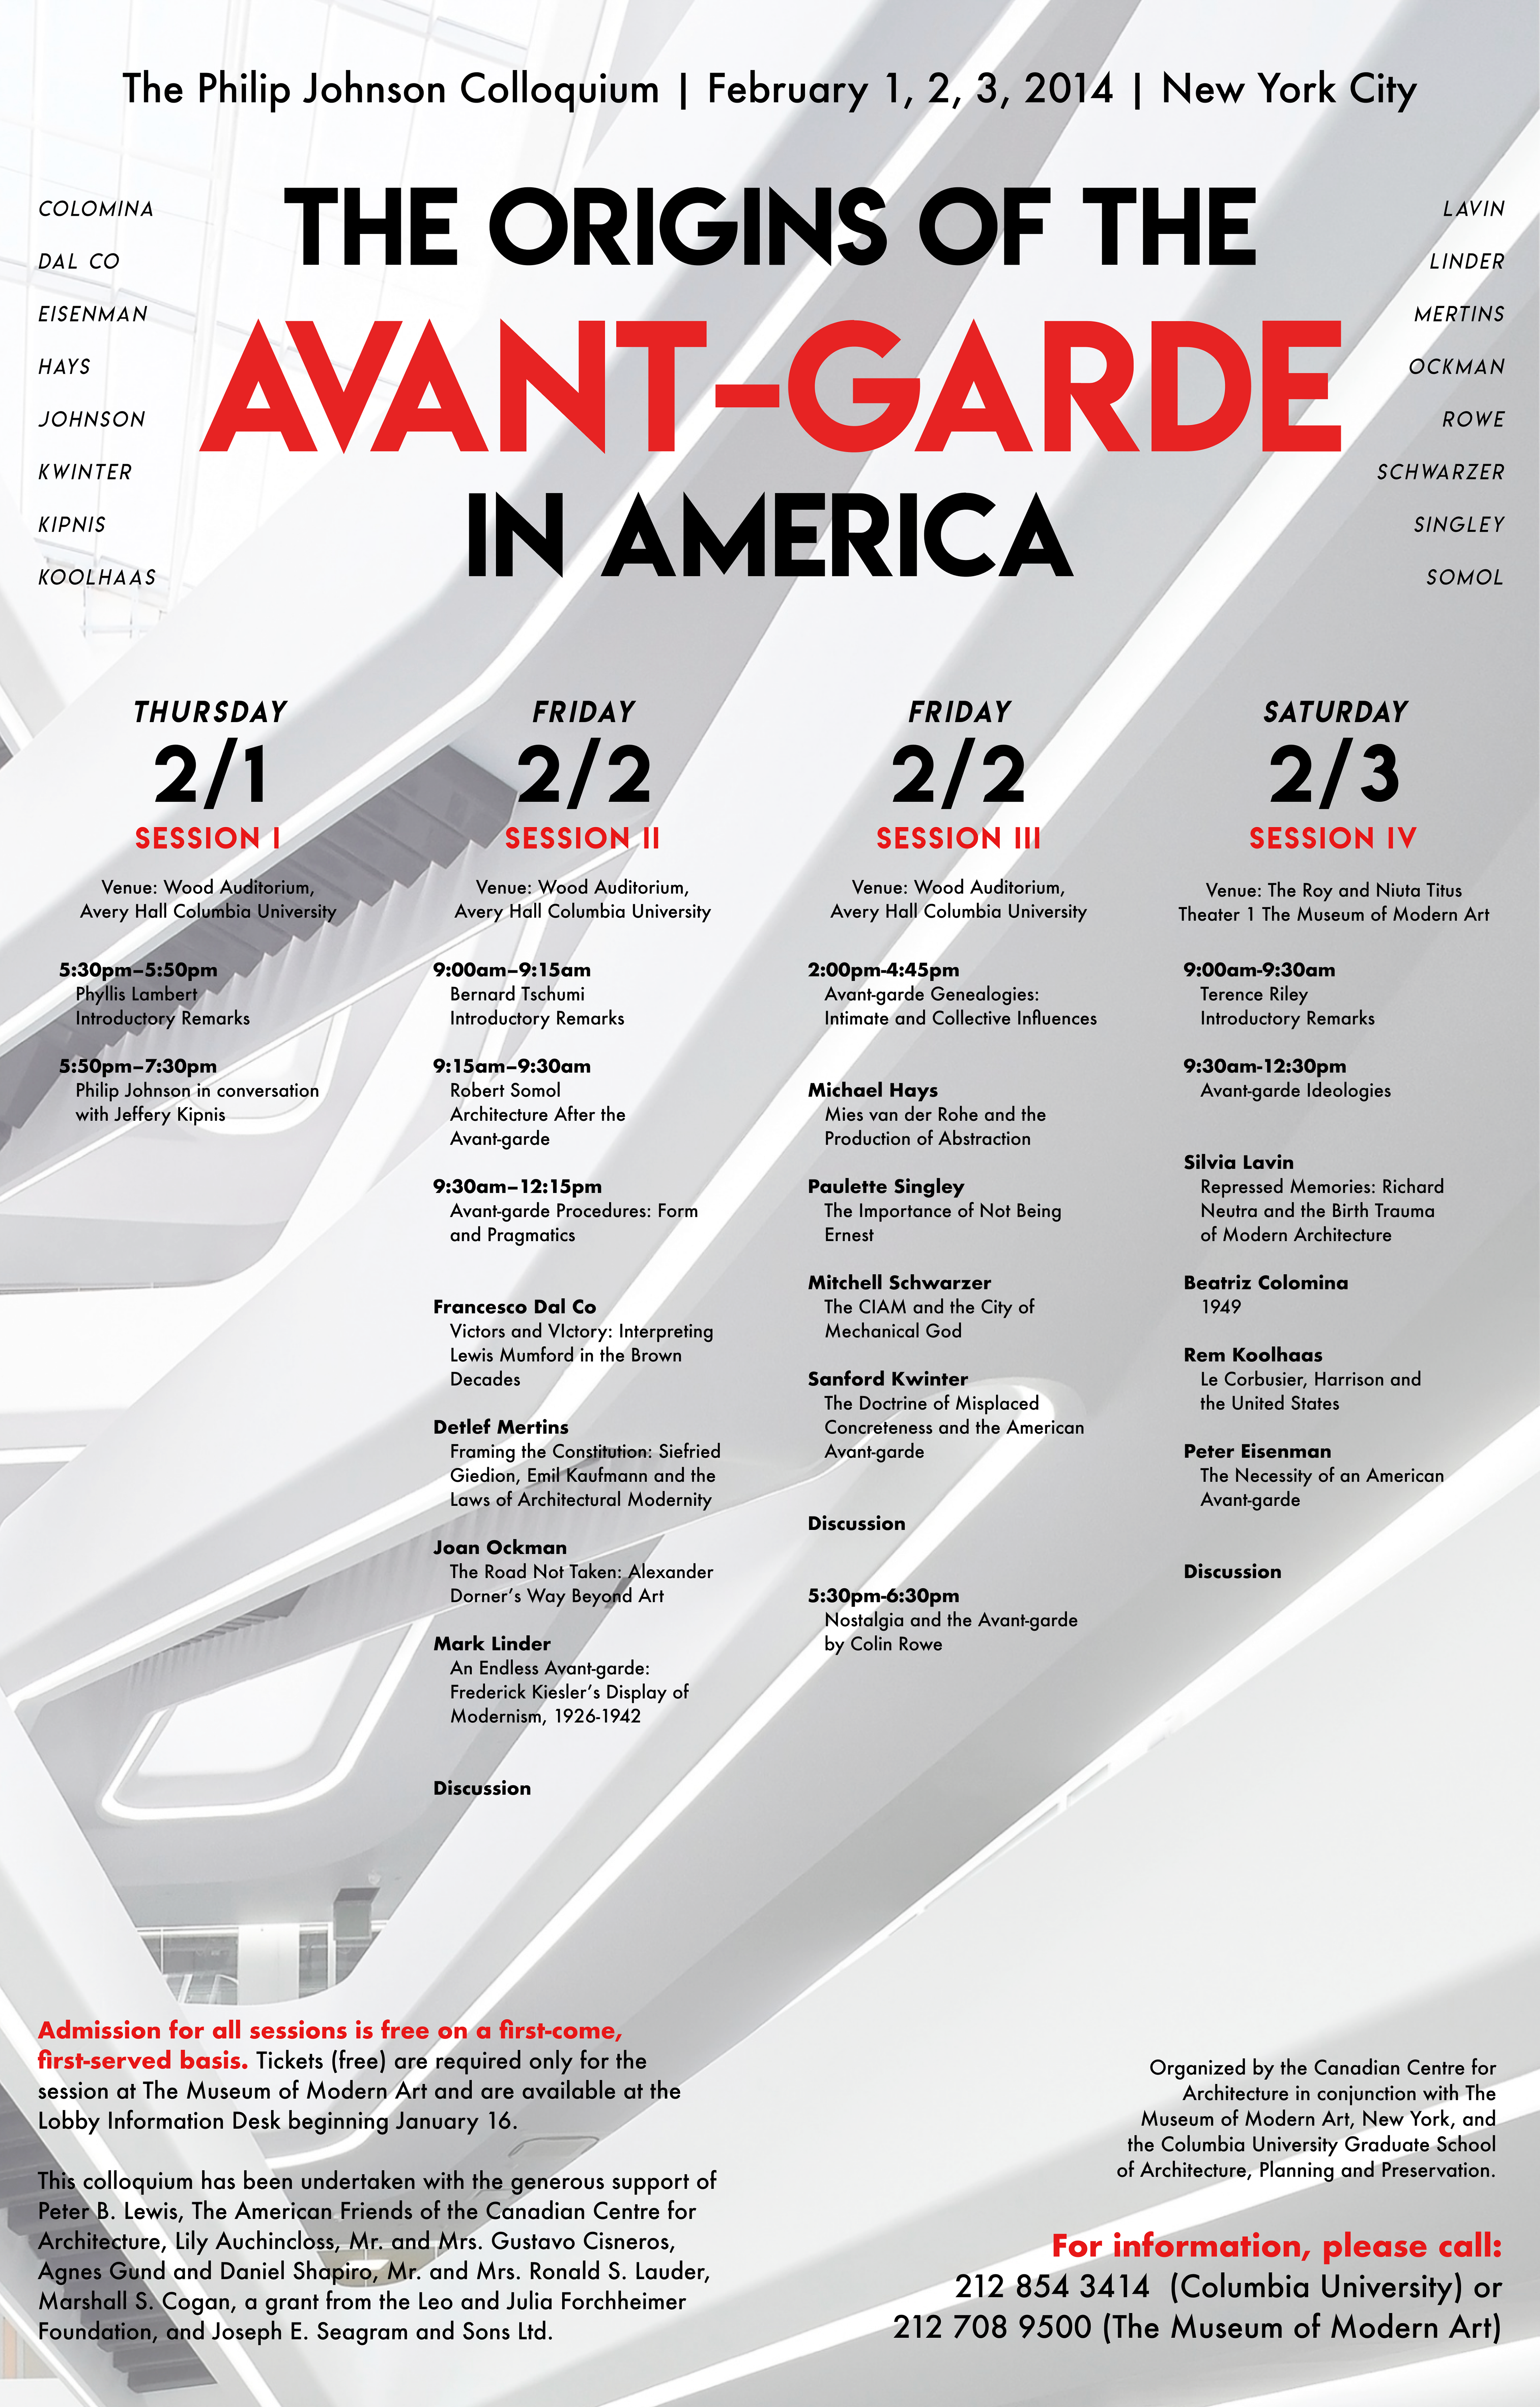
For this individual project, I was tasked to create a poster in 4 stages: 1) sketches on pen and paper, 2) text only, 3) image + black/white text, 4) image + (option of) colored text. The rightmost image is my final design, in which I received a perfect score.
Throughout this project, I received critique and feedback from peers and instructors on each stage, and I learned so much about text layout, alignment, and weight through the process. For instance, between Stage 4 and my final design, I made some critical adjustments that make it easier on the eyes to digest so much information. I aligned each column to the left to create distinct space between each session. I also aligned all of the times so that they would be easier to view, and I only put the speaker names in a bold weight. Take a look below at my process throughout the stages!
Tools: Figma, Adobe InDesign
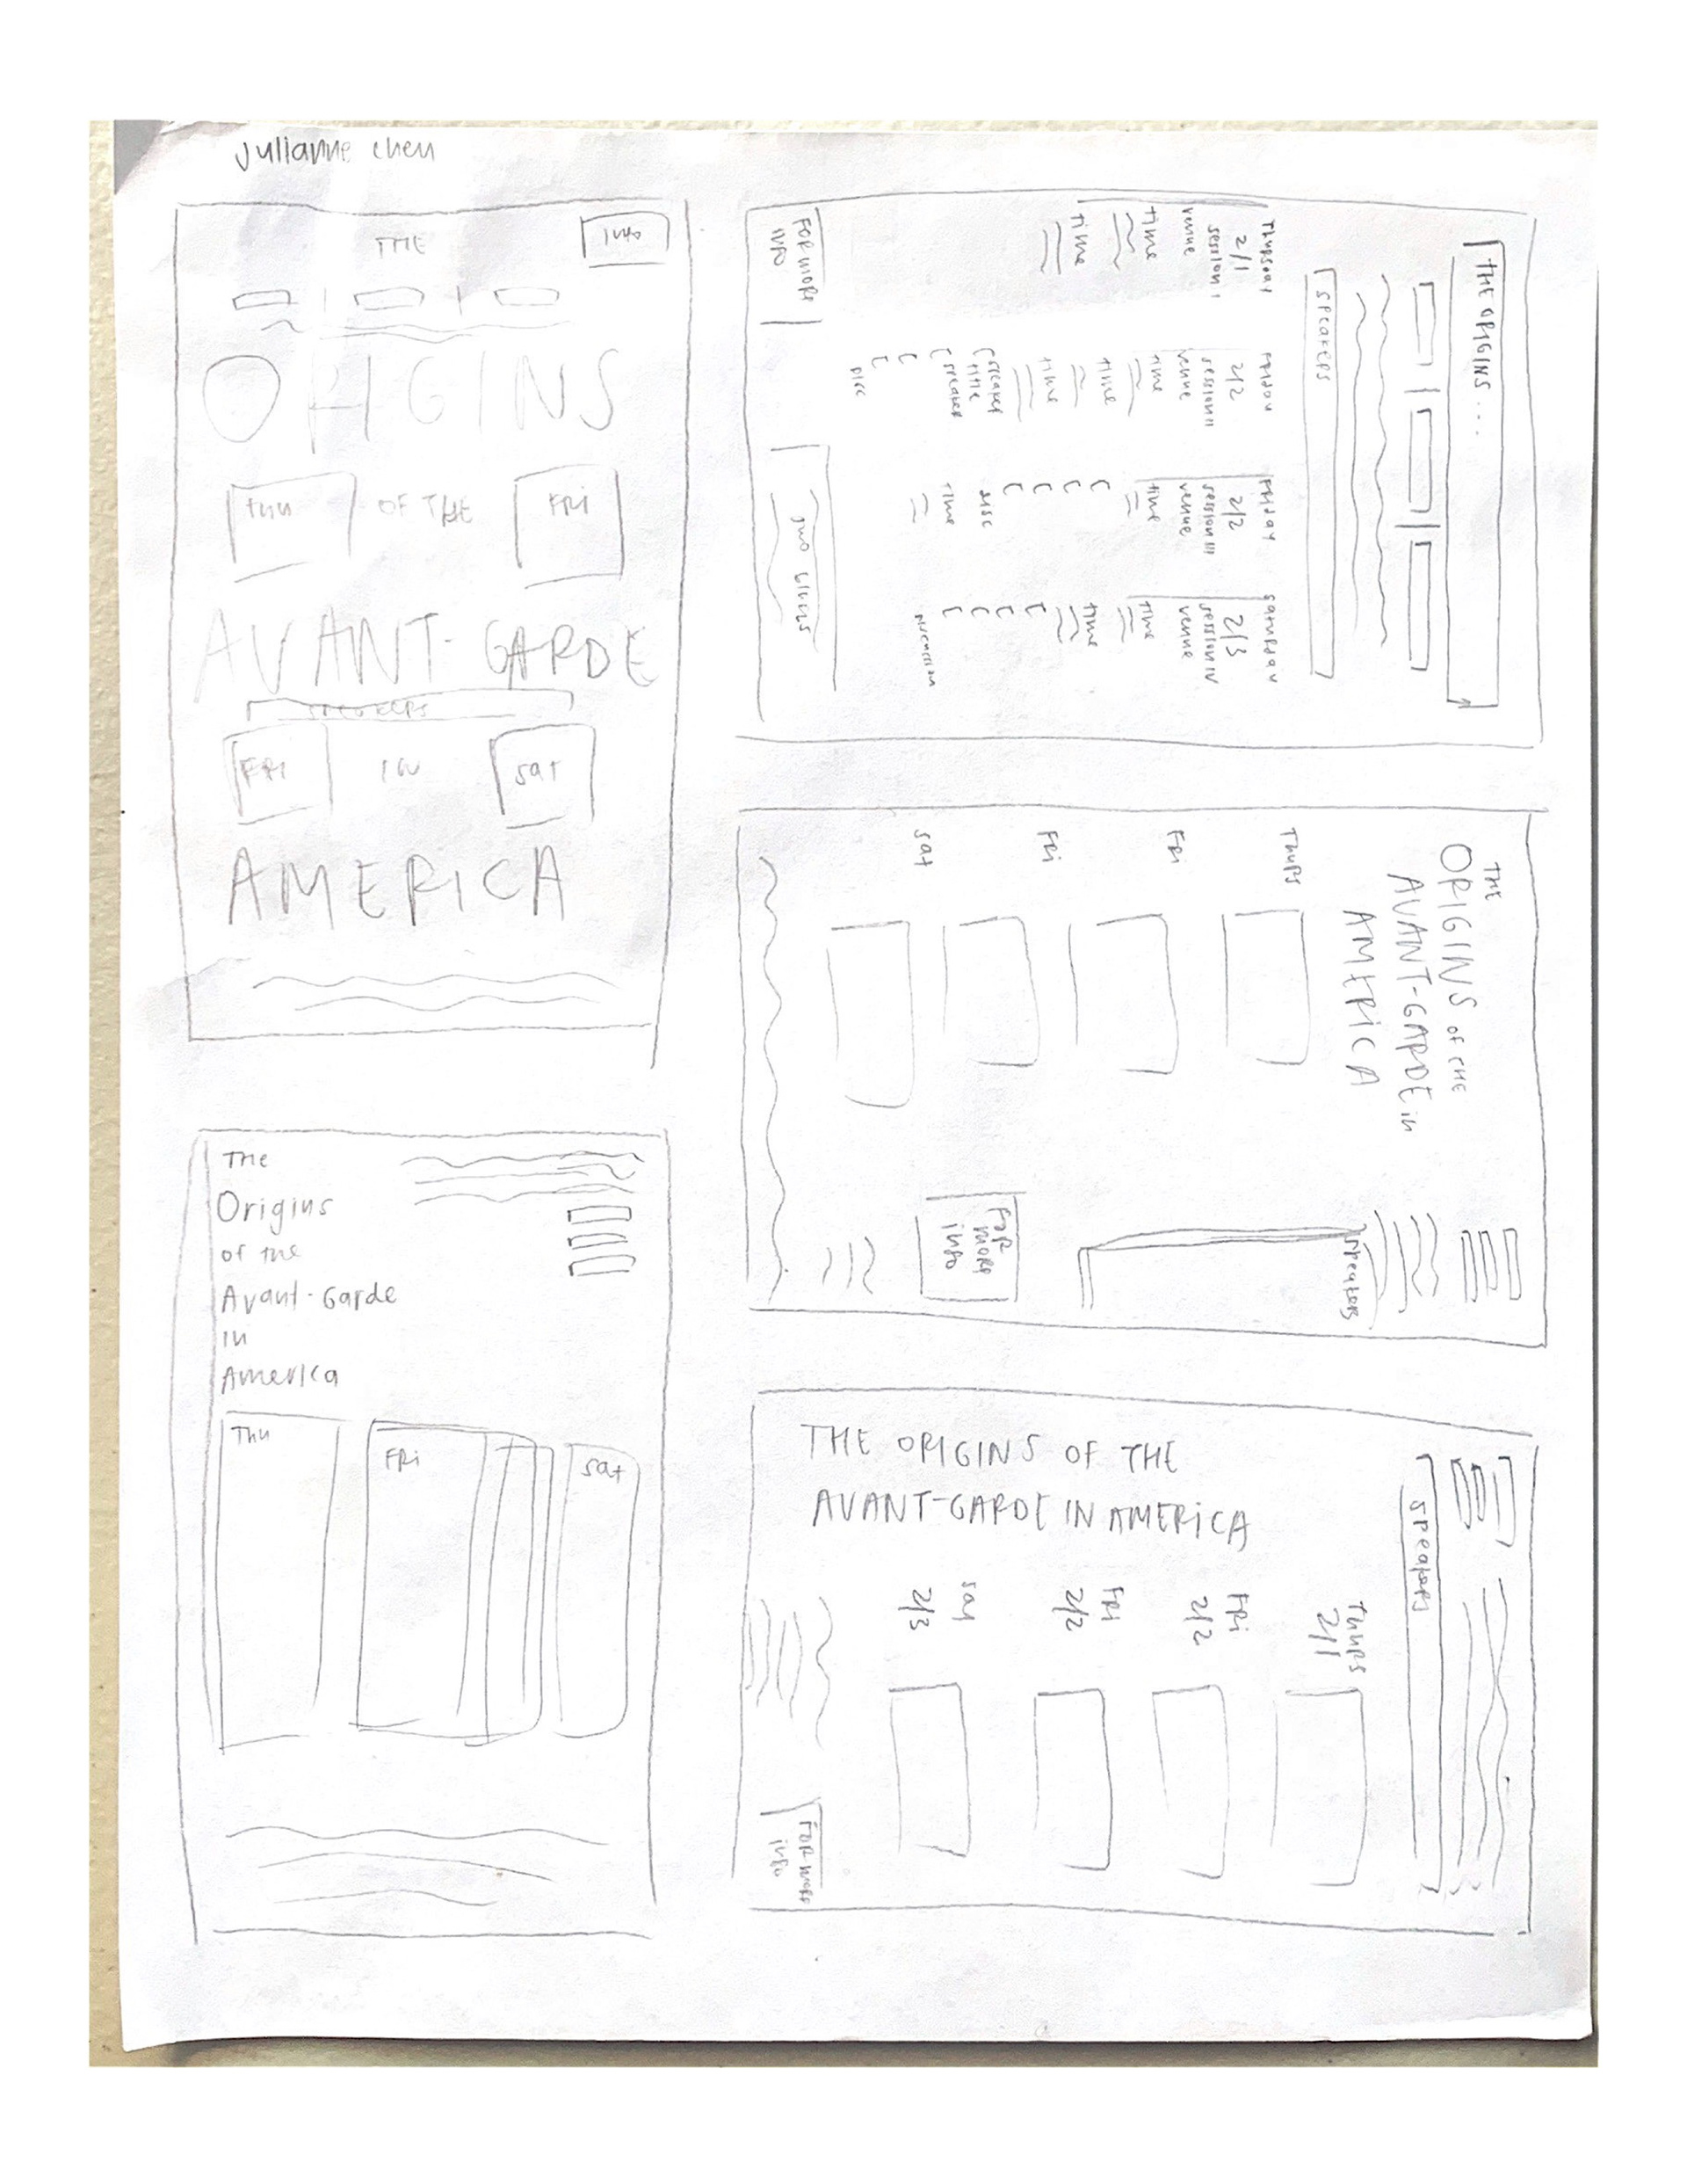
Stage 1
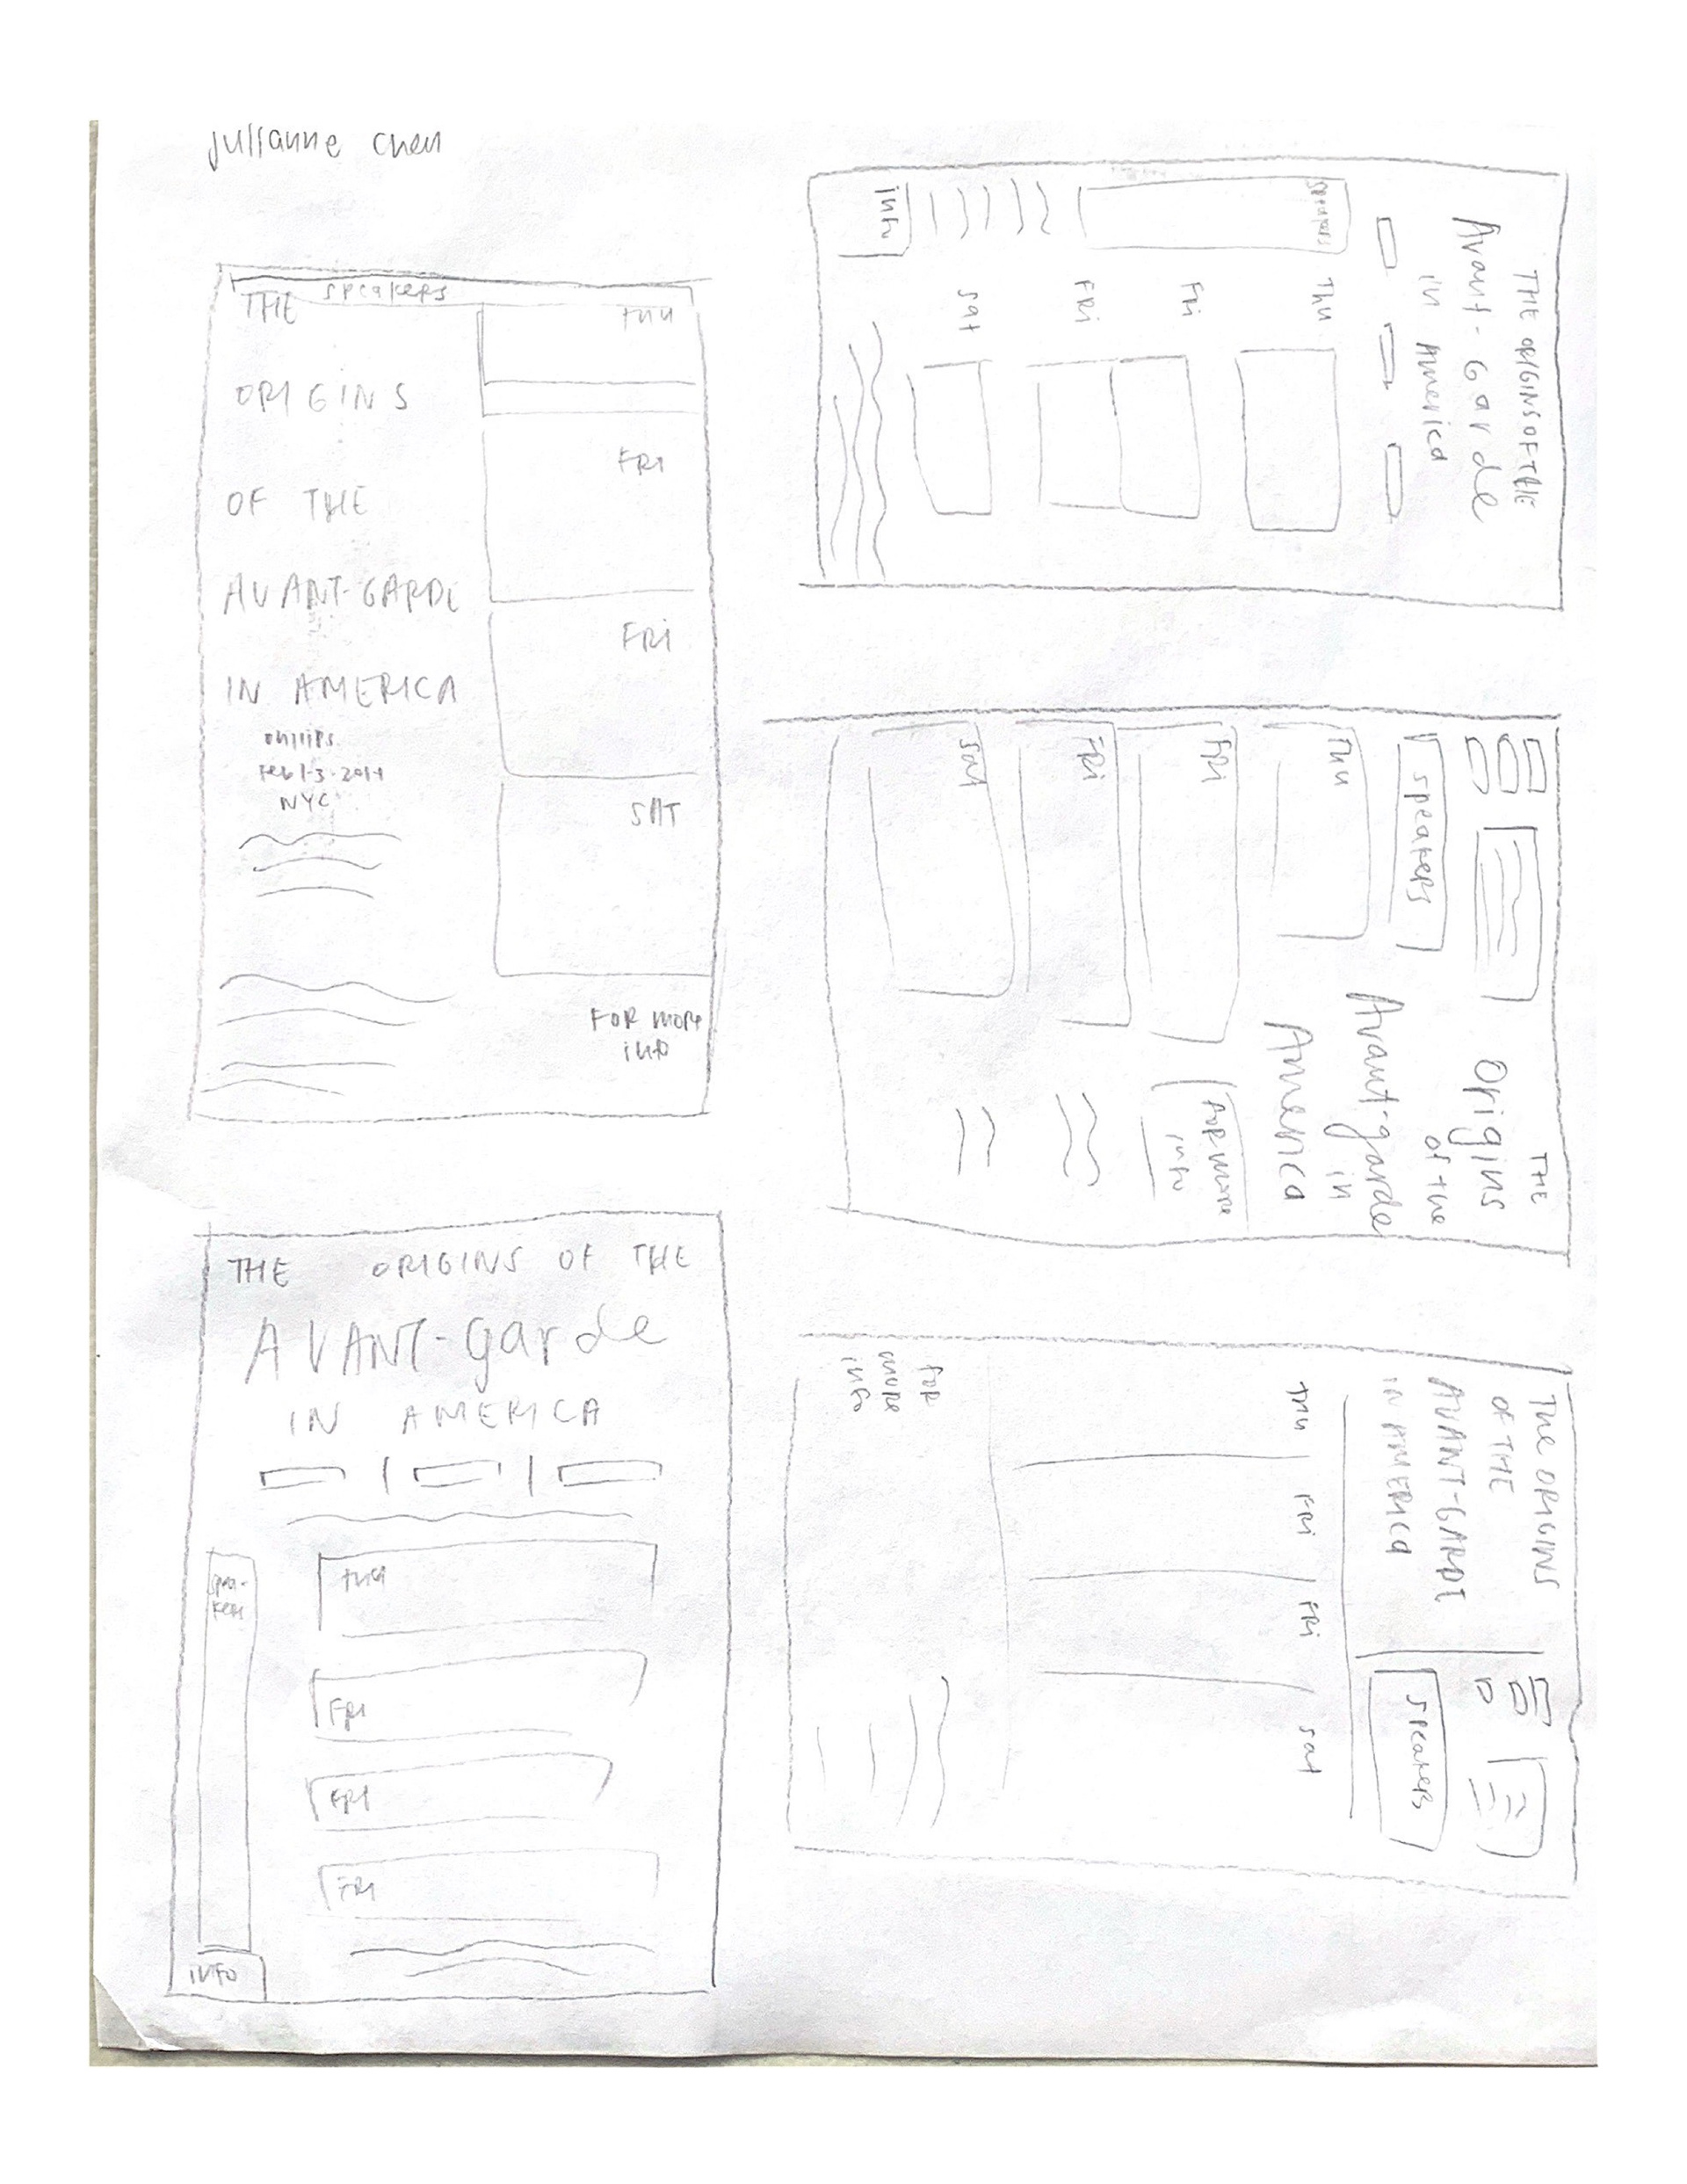
Stage 1
Stage 2
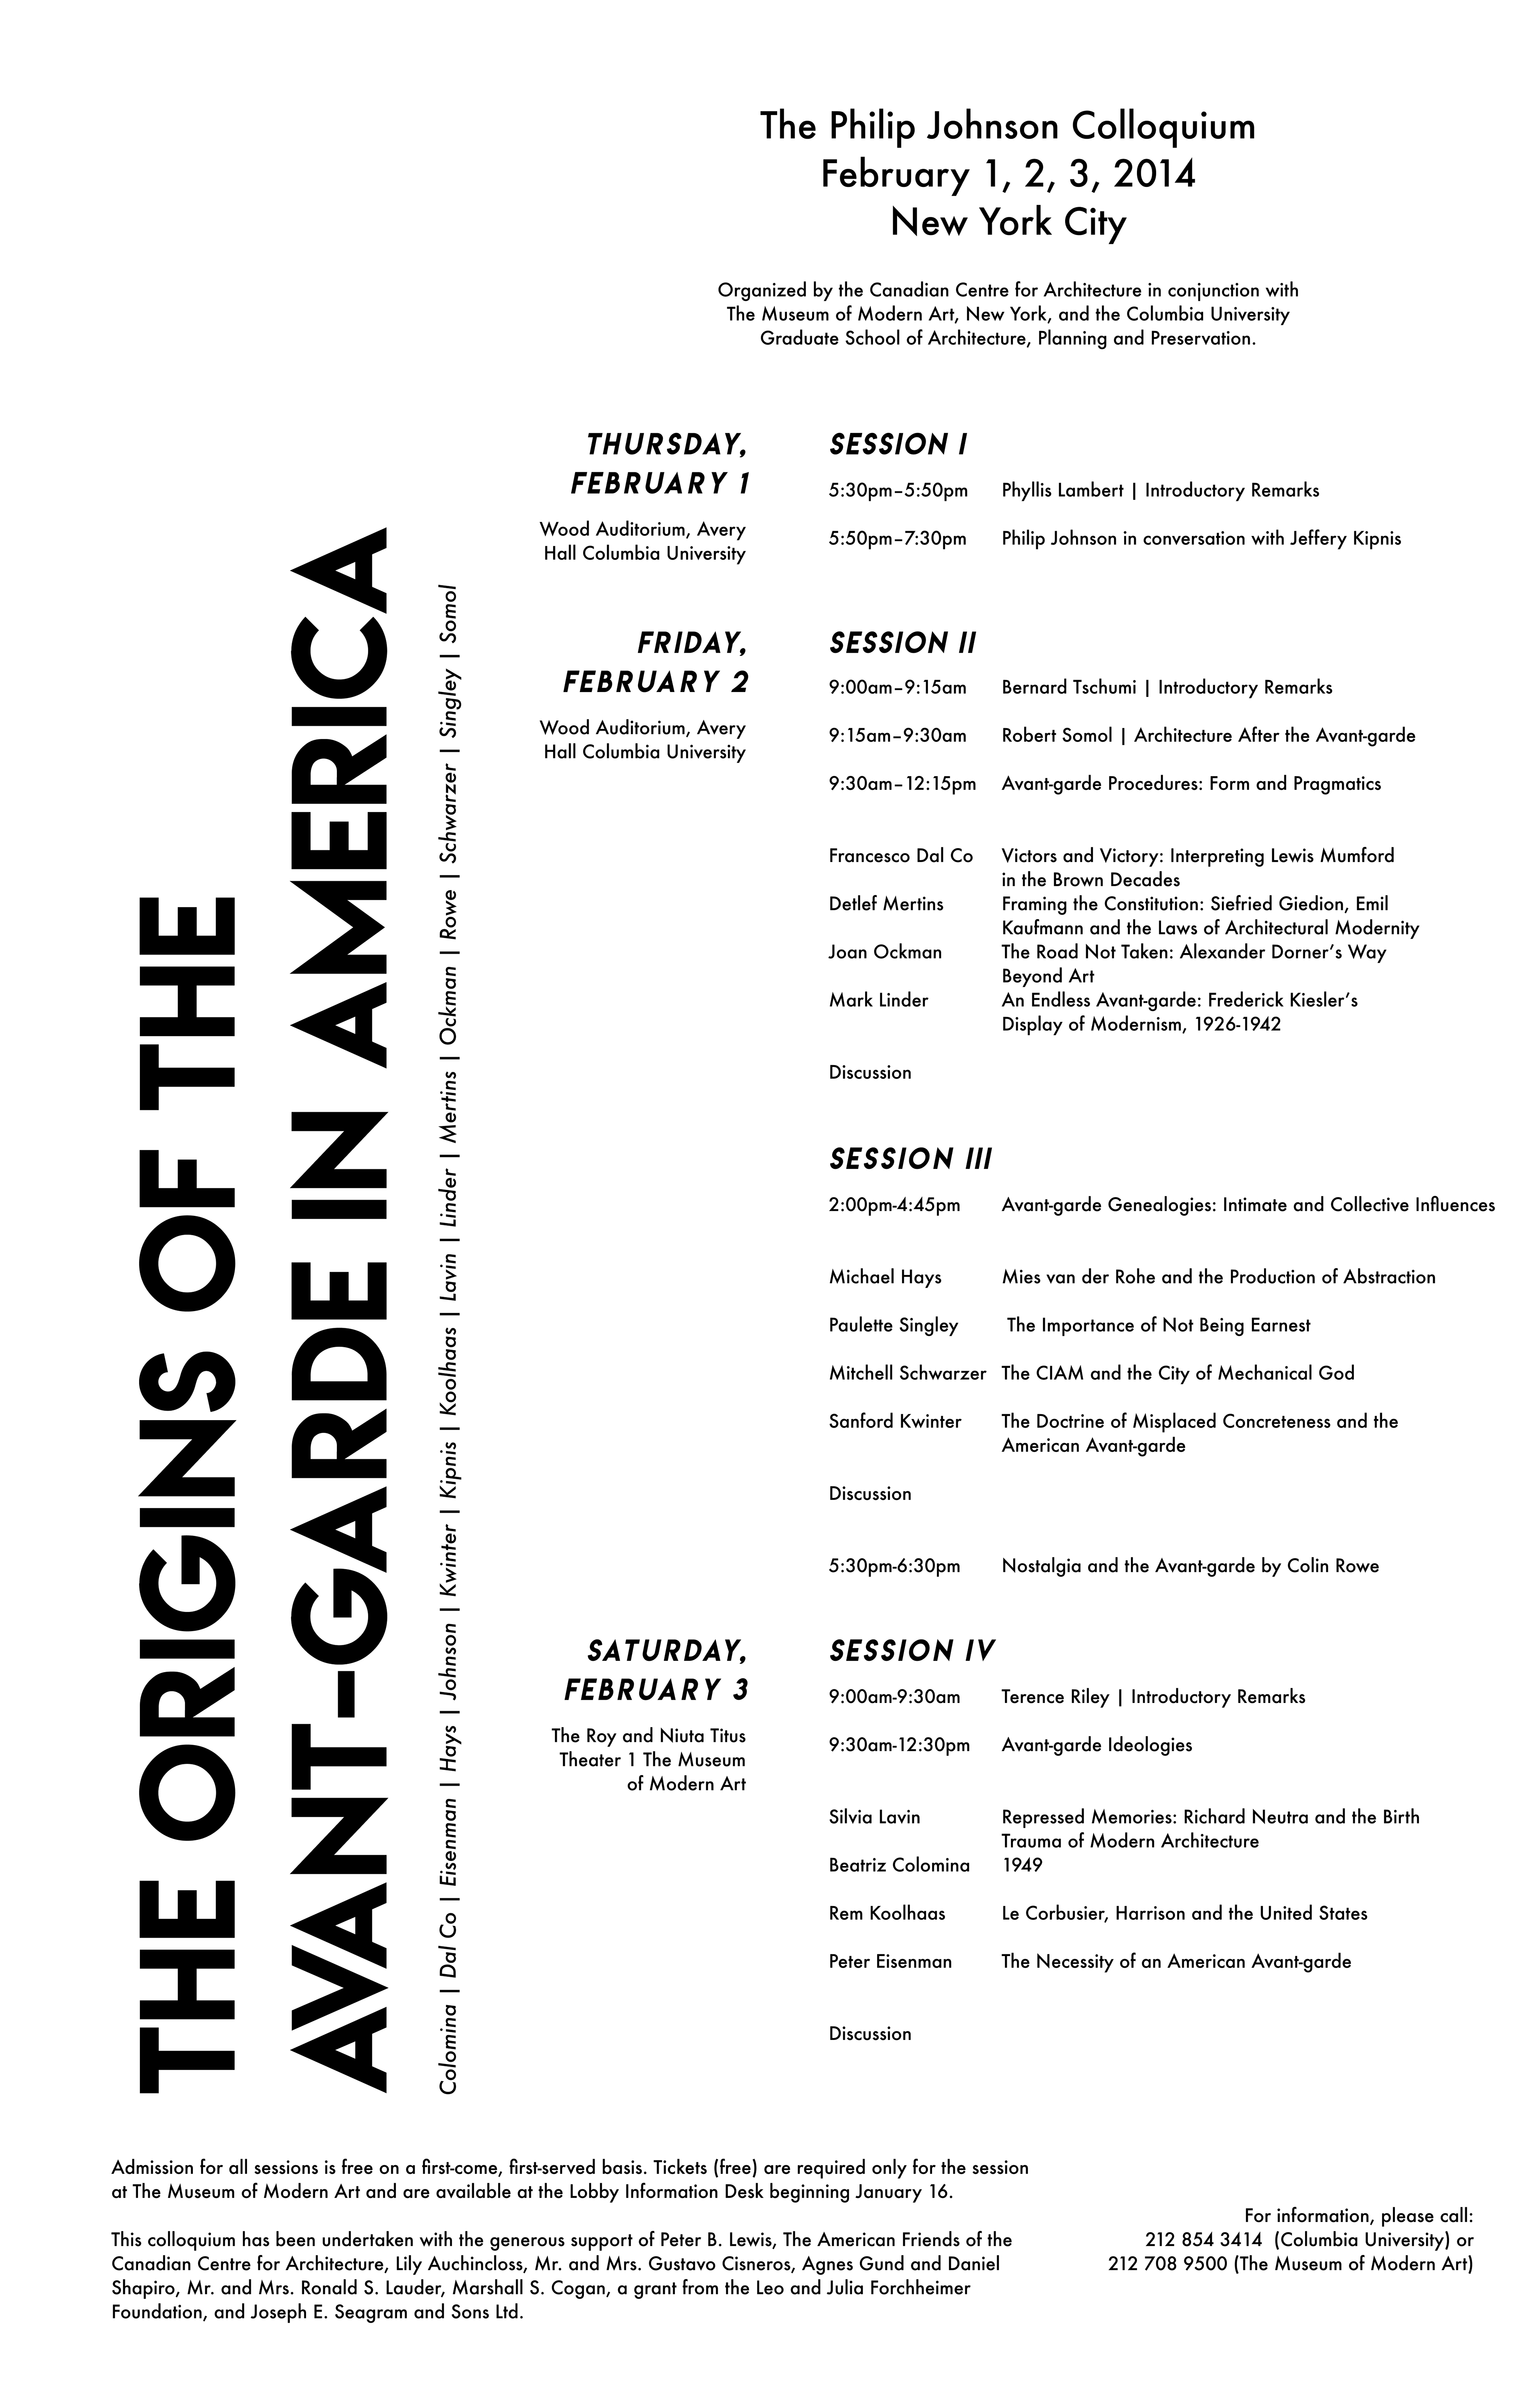
Stage 2
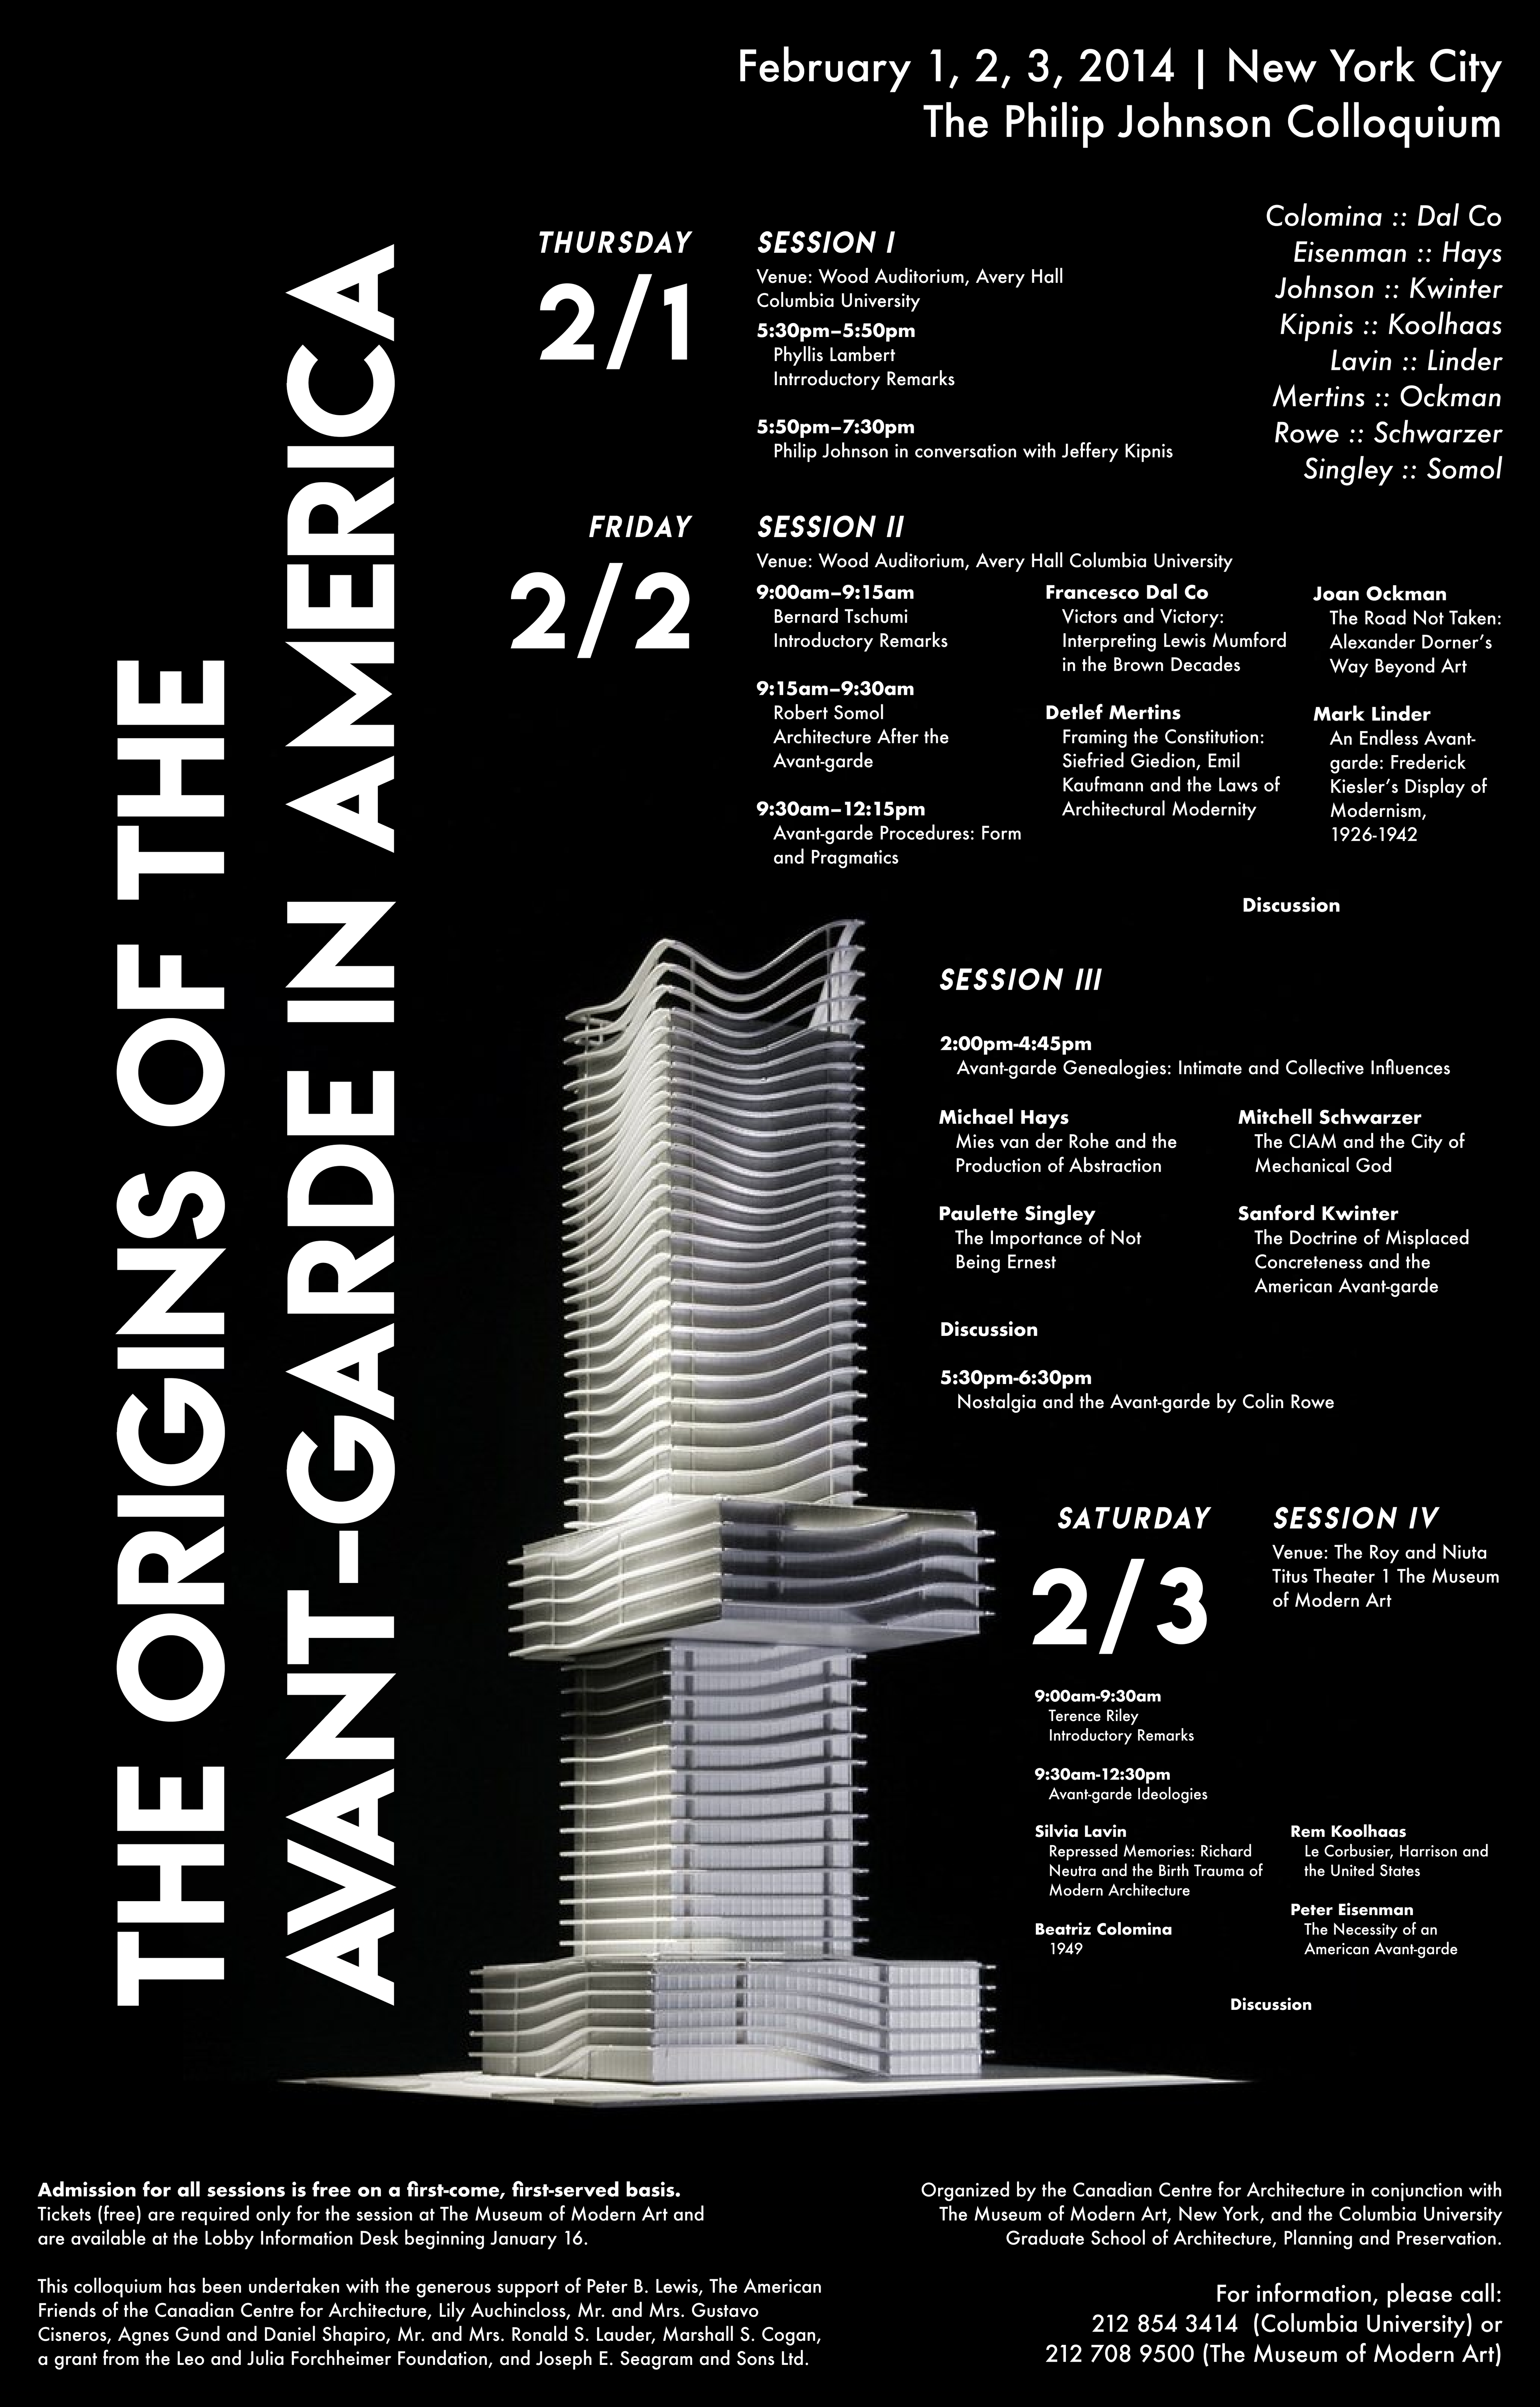
Stage 3
Stage 3
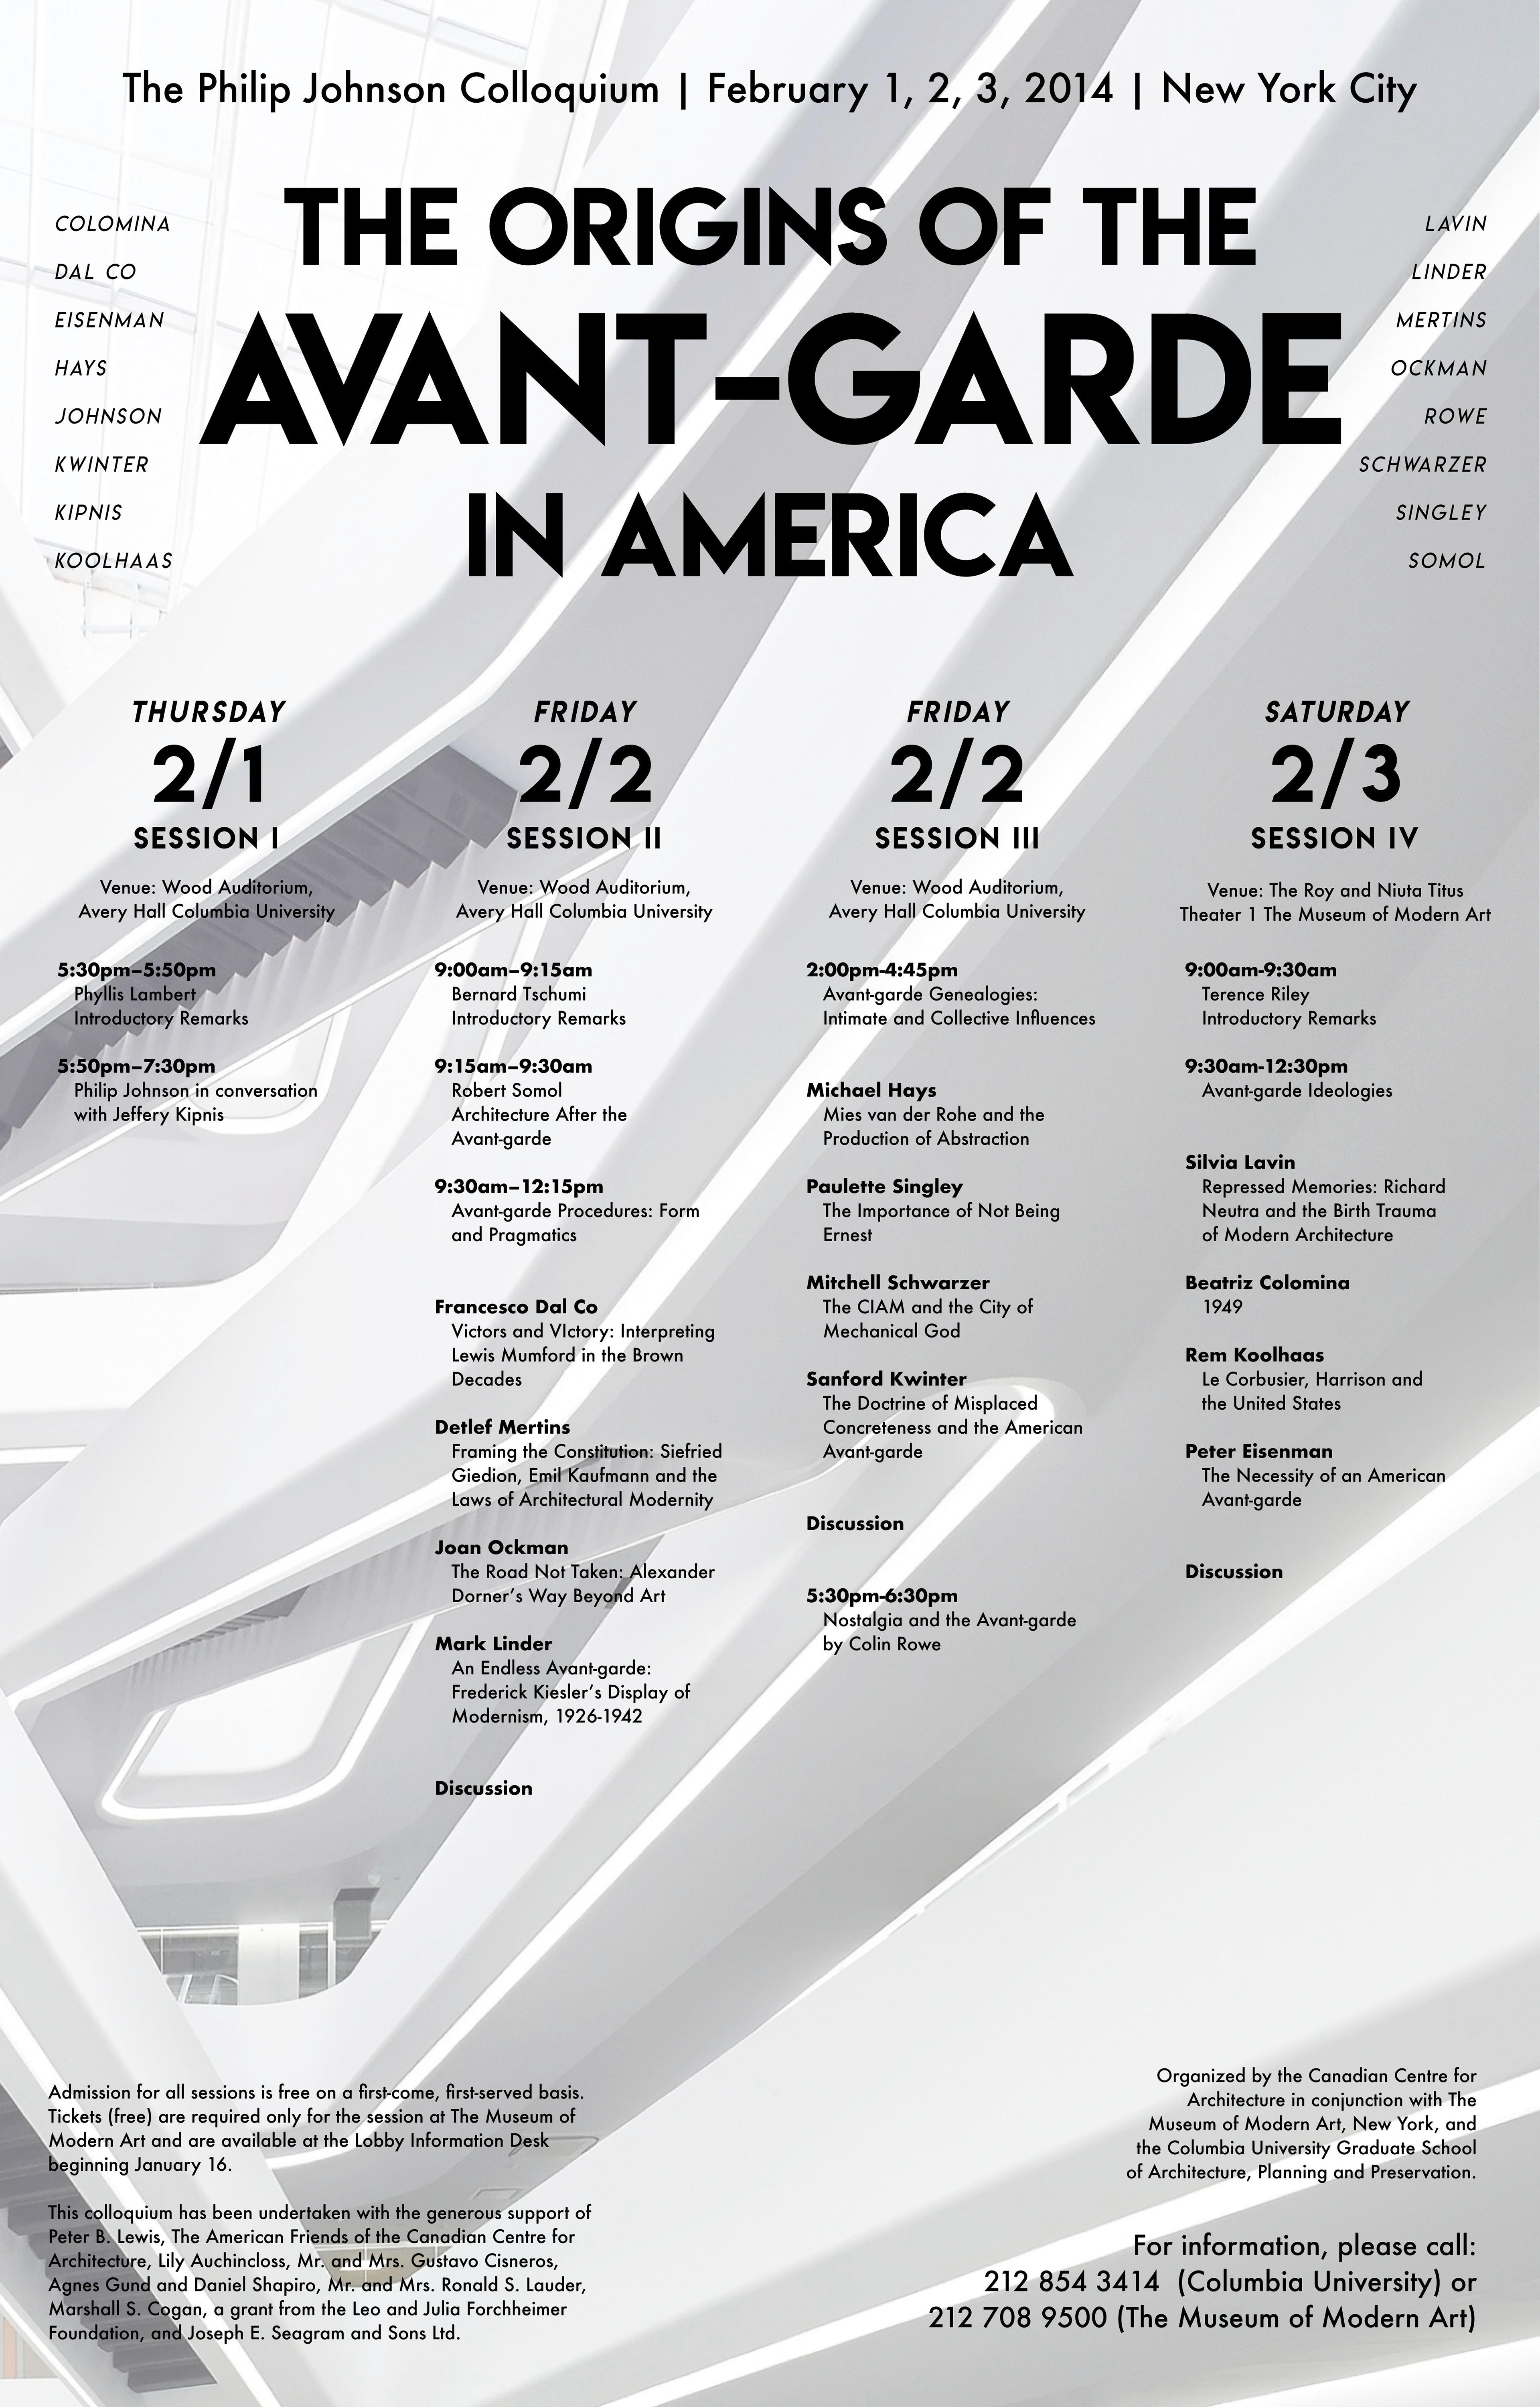
Stage 4

Final Design
iNFORMed: User Research and Prototyping (May – June 2020)
In this project, I was put in a team with four other classmates. Given the premise of COVID-19, each team was tasked to choose a design brief that explored the pandemic from different human-centered perspectives. The four broad topics were: Home Isolation, Community Resources, Safety and Sanitation, and Education and Work; my group chose the "Community Resources" topic. We intended to focus on how the public could combat misinformation surrounding COVID-19 and how we could potentially provide a resource where people could access reliable and accurate information.
The two parts of this project are detailed as follows:
User Research: Google Form questionnaire, interviews, personas, storyboards
Prototyping: sketches, wireframes, mood board, style guide, low and high fidelity prototypes, user testing
Tools: Figma, Balsamiq, Calendly, Google Drive, Slack, Zoom
User Research: Overview and Insights
After conducting preliminary research on our topic of misinformation, we created a Google Form questionnaire which was deployed to participants whom we recruited from both our personal circles and by posting on social media such as Facebook (public groups), LinkedIn, and Twitter. Our scope was California residents only, and we ended up having a total of 121 participants on our Google Form questionnaire.
From the Google Form, we learned that 77% of respondents reported that they had seen misinformation regarding COVID-19 from Facebook, 68% from news, 40% from Twitter, and 33% from Instagram. This data reinforced a point we already suspected by confirming that many people get their news from social media, even though it has proven to be unreliable.
We then recruited a few people (mostly strangers) from those who filled out the Google Form and we held a brief 30-minute interview with each individual. The interview included broader questions such as asking what the participant thought of COVID-19 misinformation and the stay-at-home quarantine; it also included more specific questions such as asking what information or resources would be desirable to help the participant. From the interviews, we learned that people wanted to see COVID-19 information that was relevant for their location and that the information should be easily understandable. Additionally, we learned that people would like to see a place where updated hours of stores near them could be displayed, since many stores implemented senior hours during the pandemic.
Then, based on the data from the Google Form questionnaire and interviews, my team created fictitious personas that depicted the archetype stakeholders in our problem context. We also created storyboards (shown below), which are scenarios that describe problematic situations for our stakeholders. The four panels of each storyboard represent: 1) the context, 2) the problem, 3) the proposed solution, and 4) a resolution.
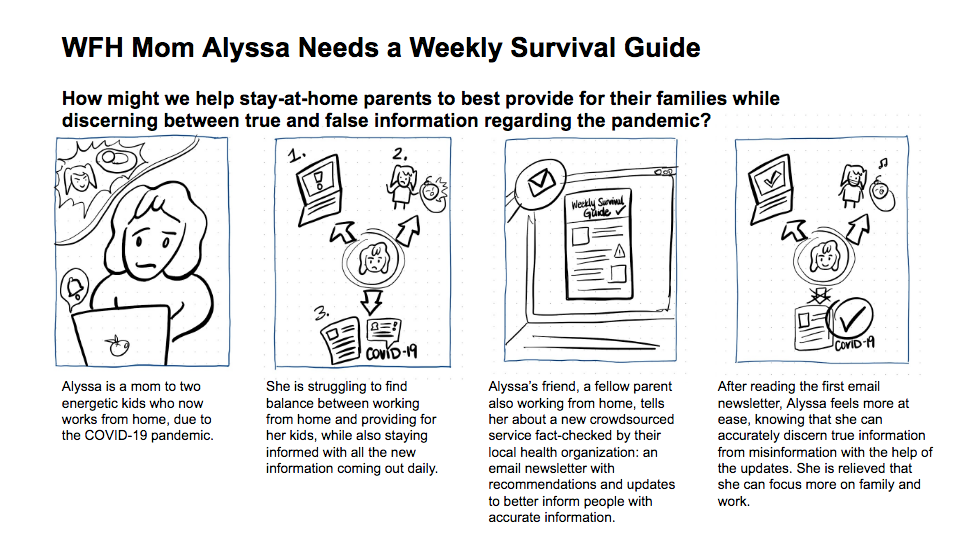
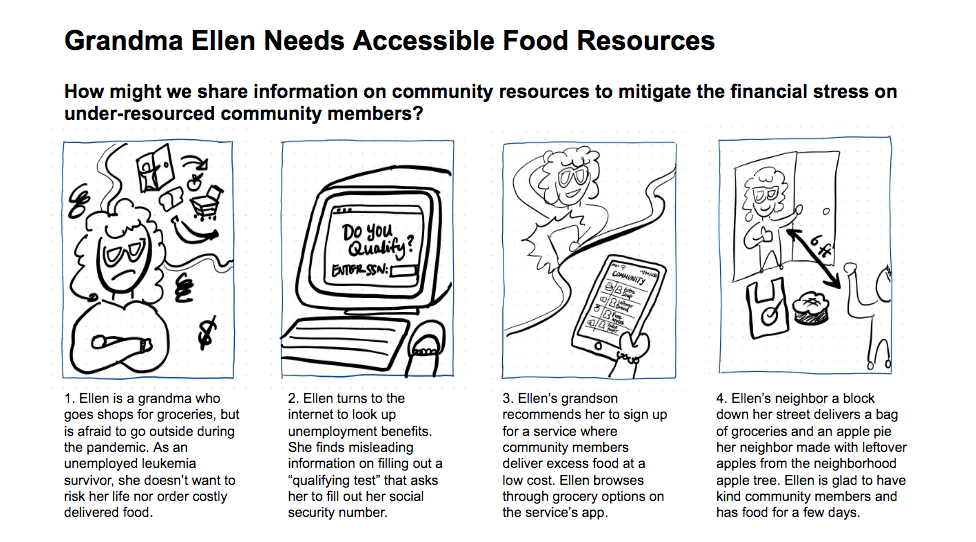
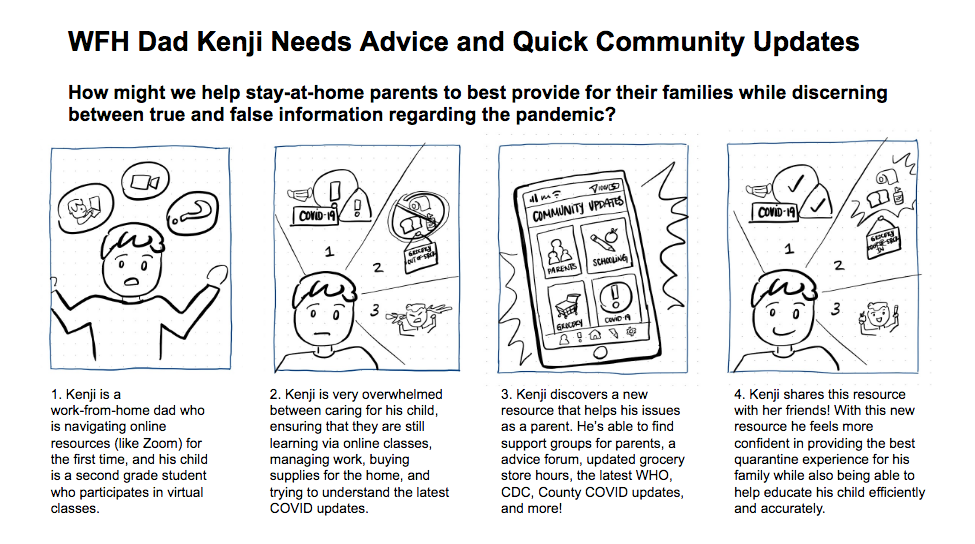
storyboards based on our personas
Prototyping: Overview
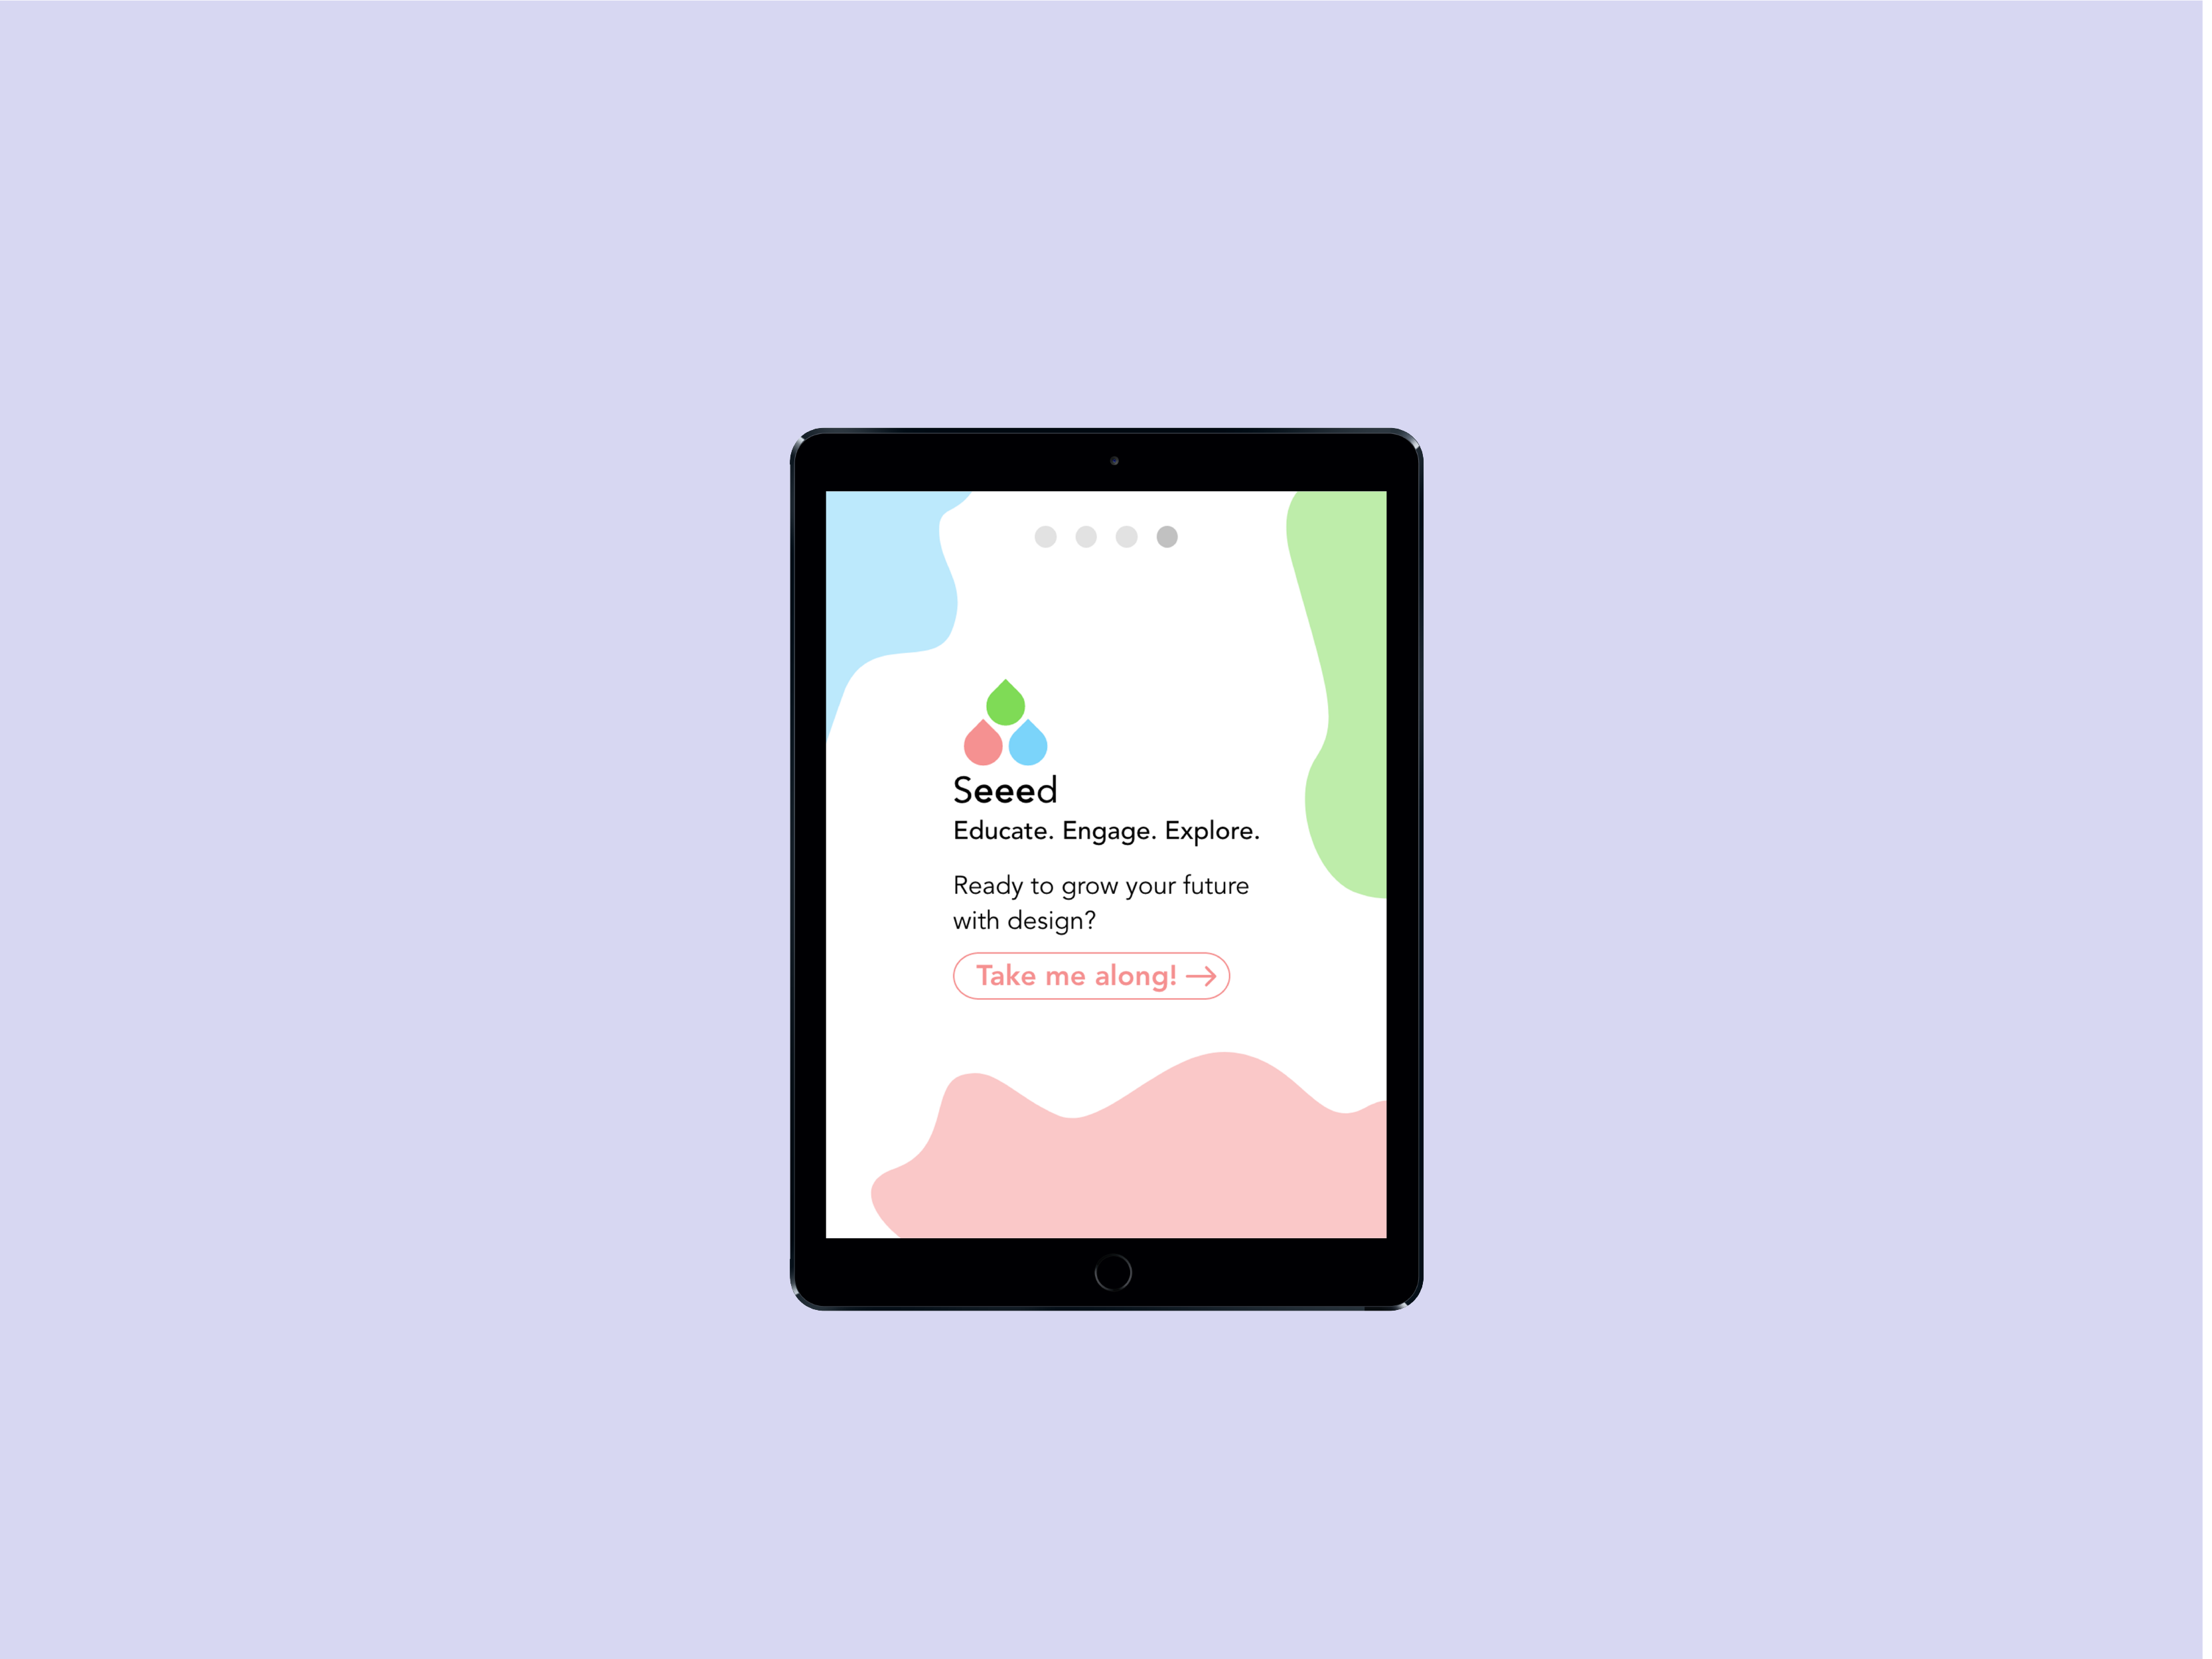
After User Research, my team decided to create a platform on which we would provide resources, information, and, most notably, a Q&A forum function where users could ask COVID-related questions and participate in discussions. We wanted our platform to be tailored to specific counties in California, so that people could receive information that was pertinent to their location. We first created sketches, wireframes, and low fidelity prototypes of what we envisioned the app to look like. Then, we discussed and finalized the color scheme of our app through our mood board and style guide.
View our design process and some of our insights below!
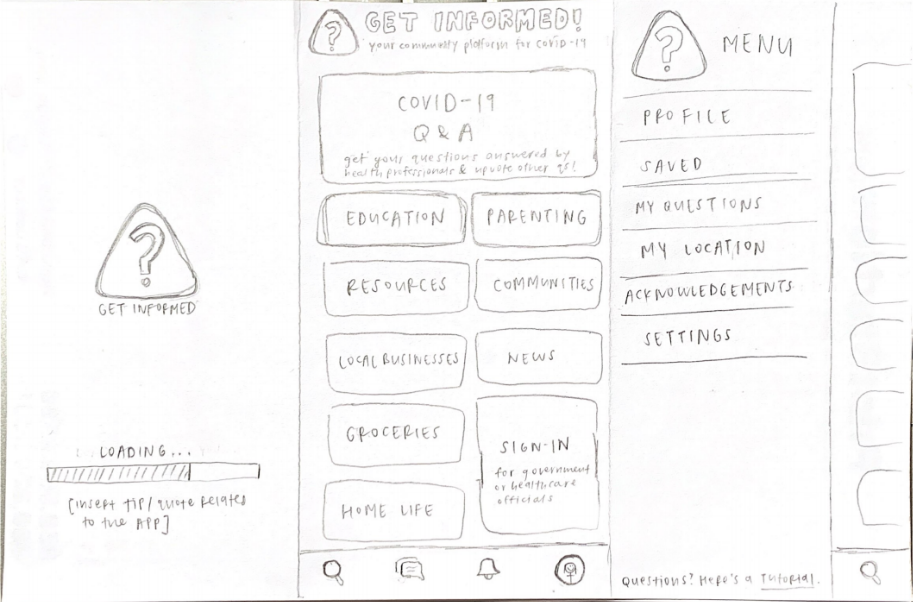
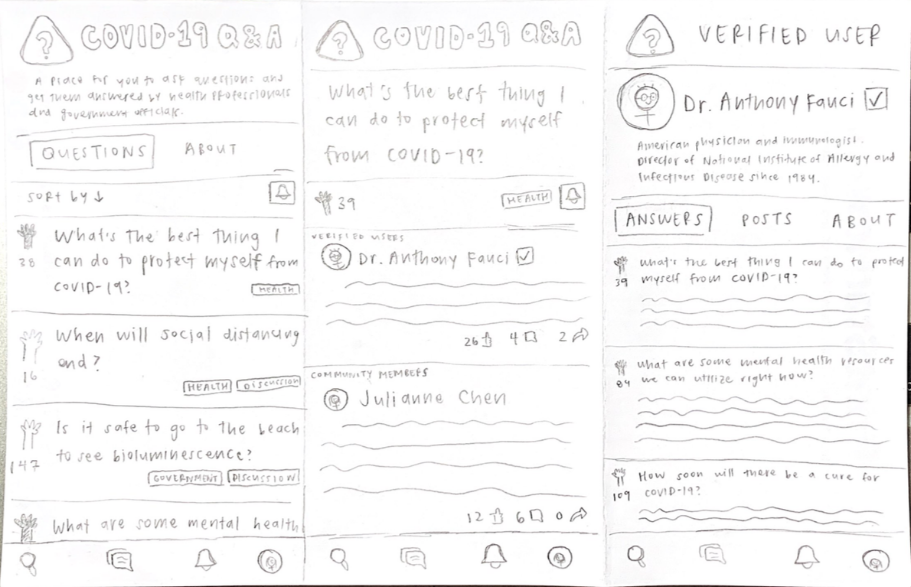
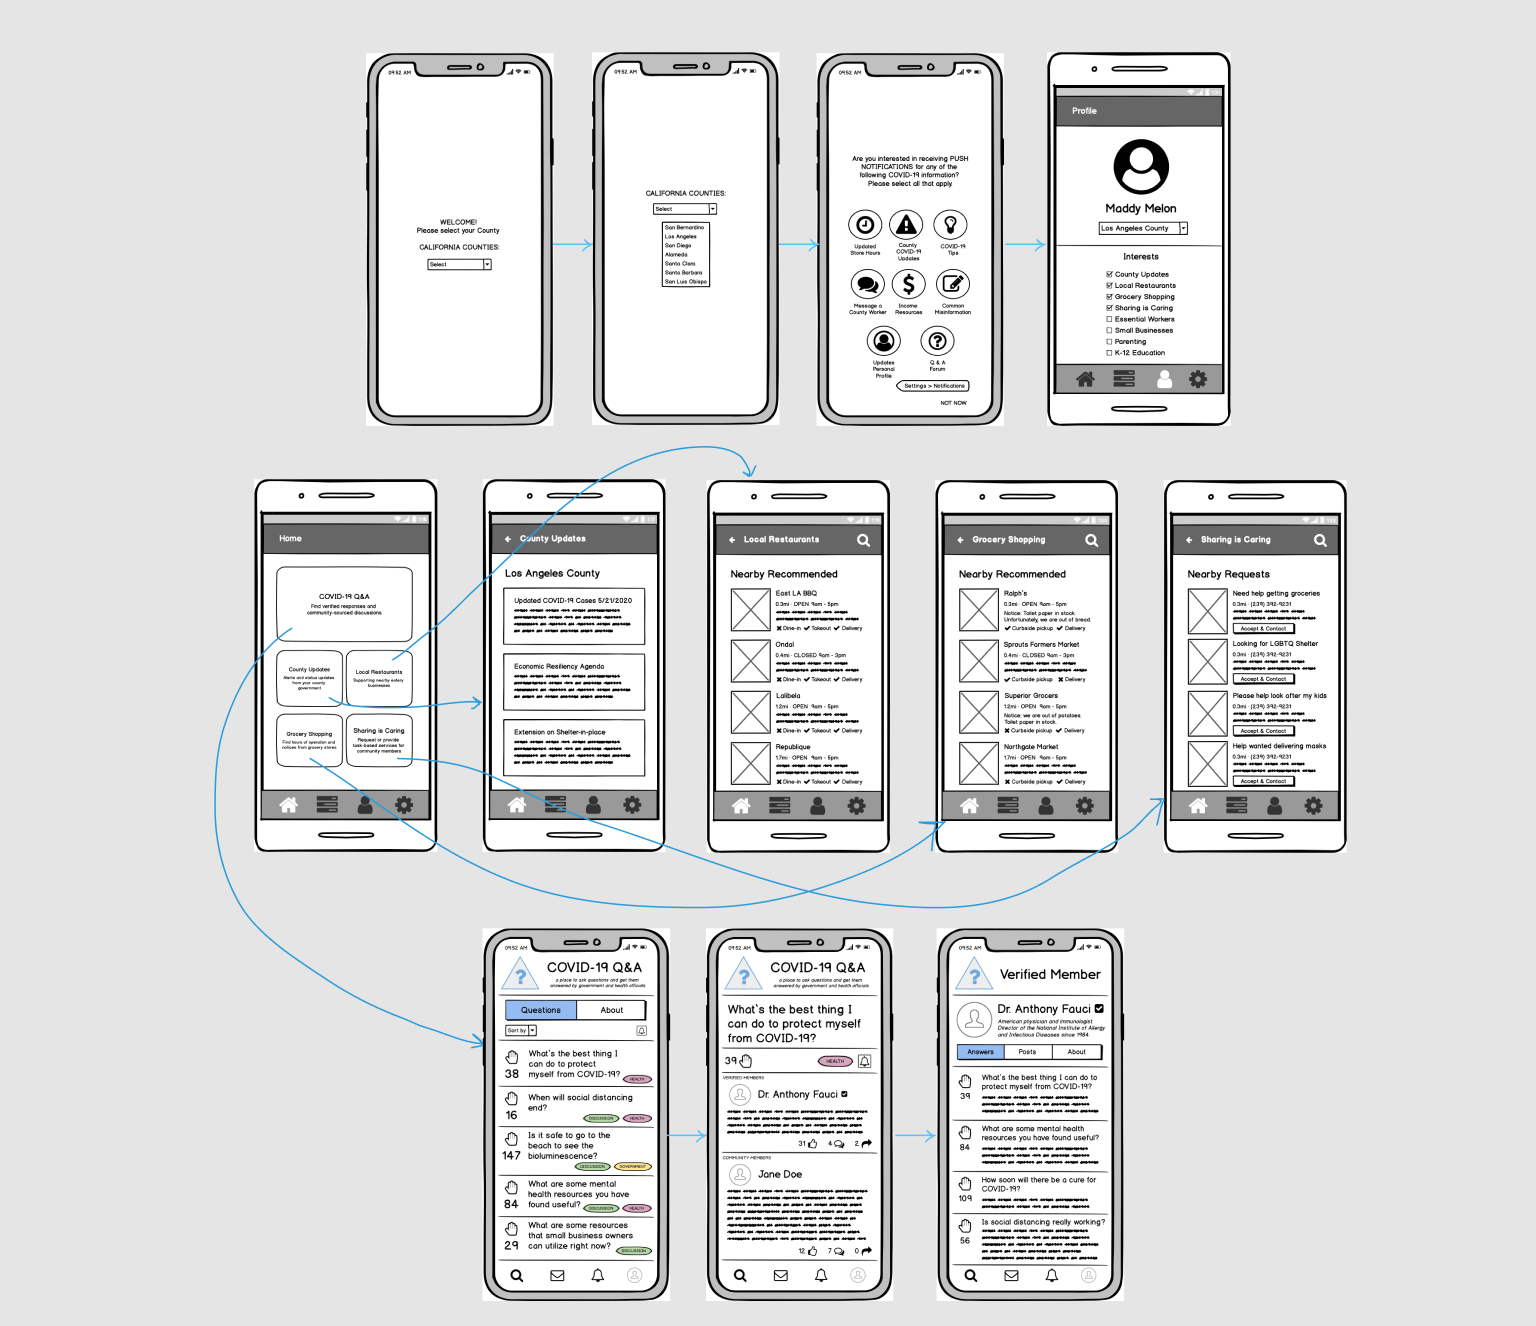
sketches, wireframes, and low fidelity prototype click through from Balsamiq
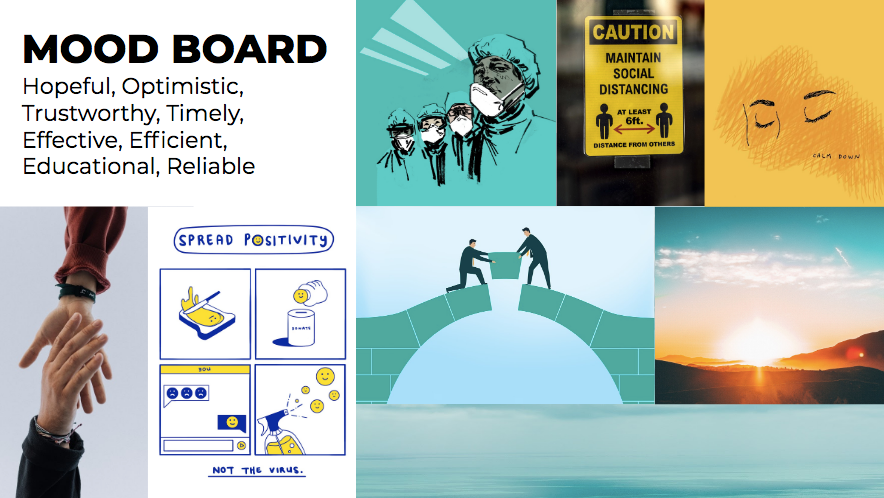
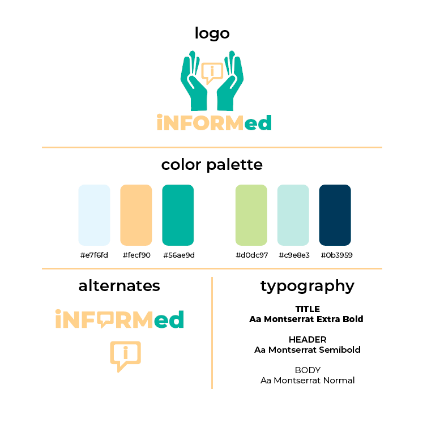
for our mood board and style guide, we chose colors that would convey a modern, calming, and cool look
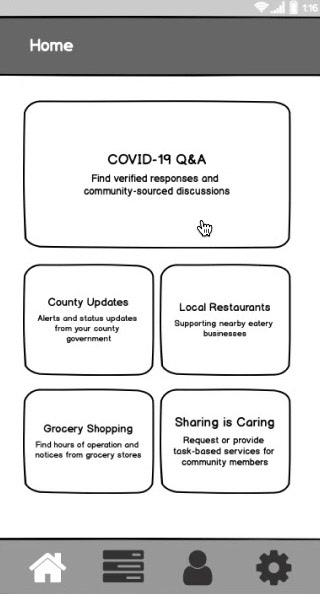
early bottom menu
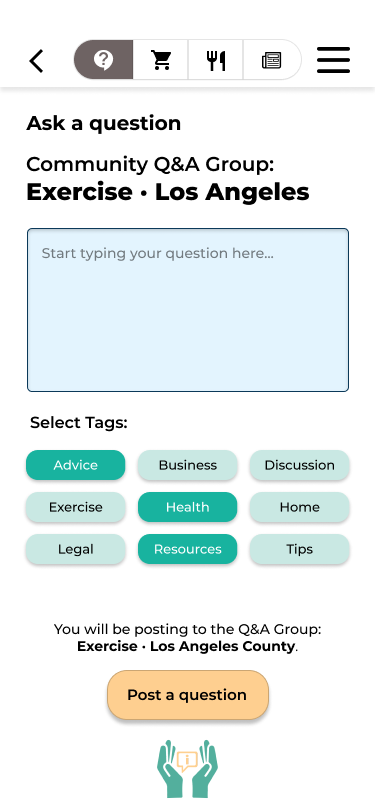
hamburger menu + top navigation bar
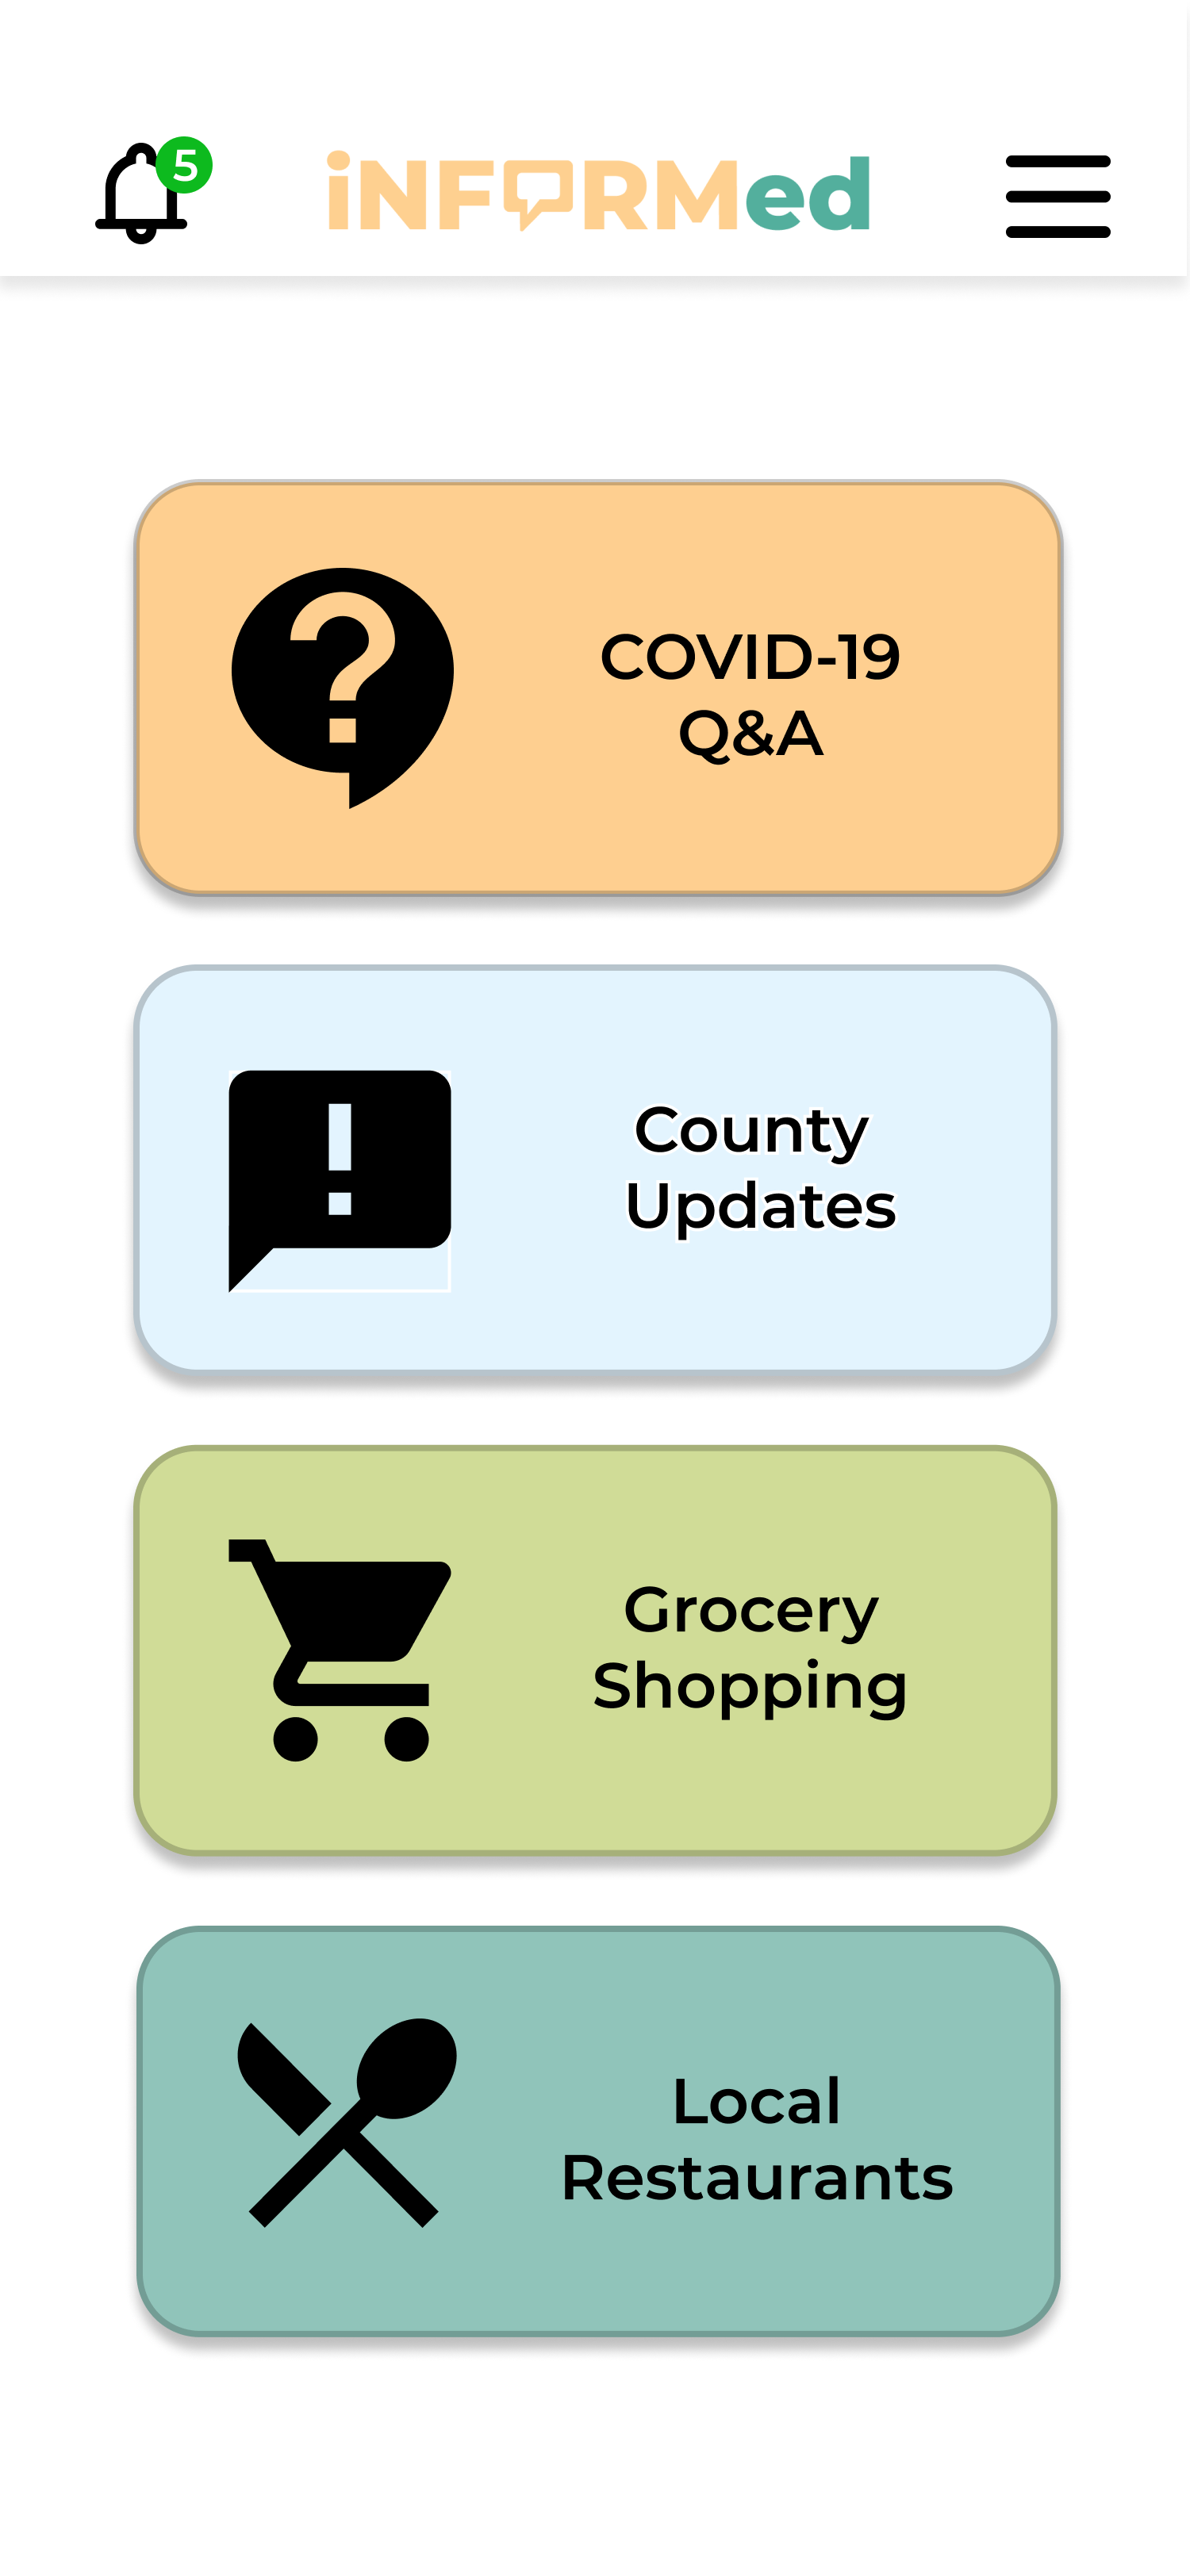
final design
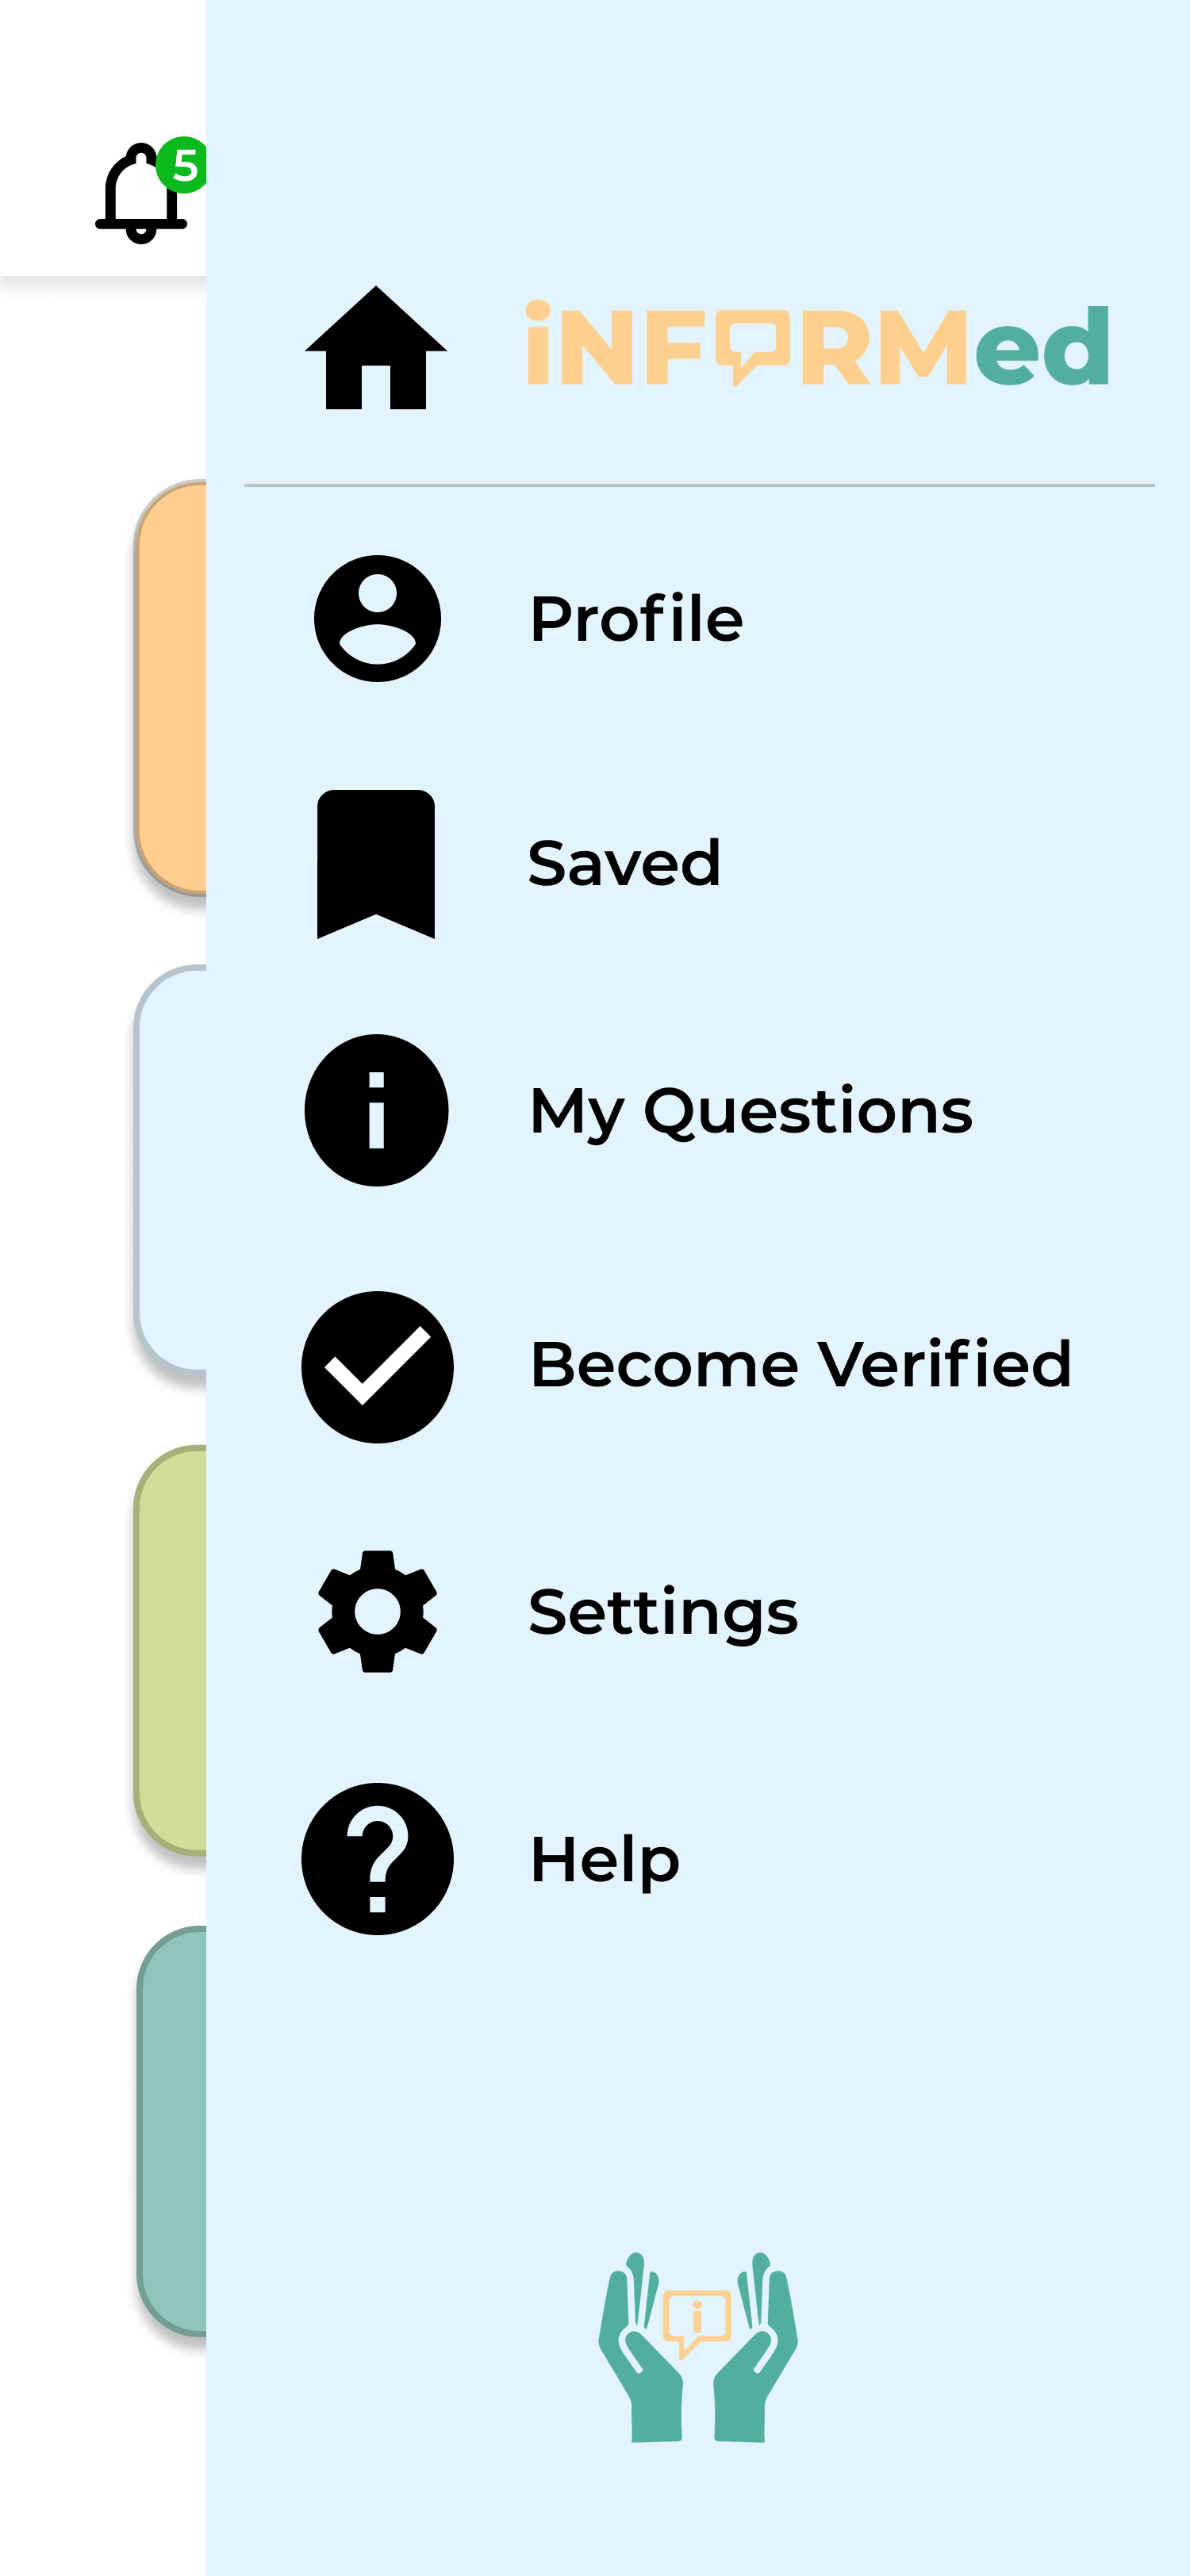
hamburger menu
Prototyping: Insights
While we were going through the low and high fidelity prototyping process, one main problem we encountered was where to put a menu button and what it should look like. We played around with the idea of having a navigation bar of sorts, with the four buttons on our home page (see second picture above). However, we knew that we wanted to keep our home page, since it was very valuable to our overall design. In the end, we settled on just the hamburger menu and keeping the home page.
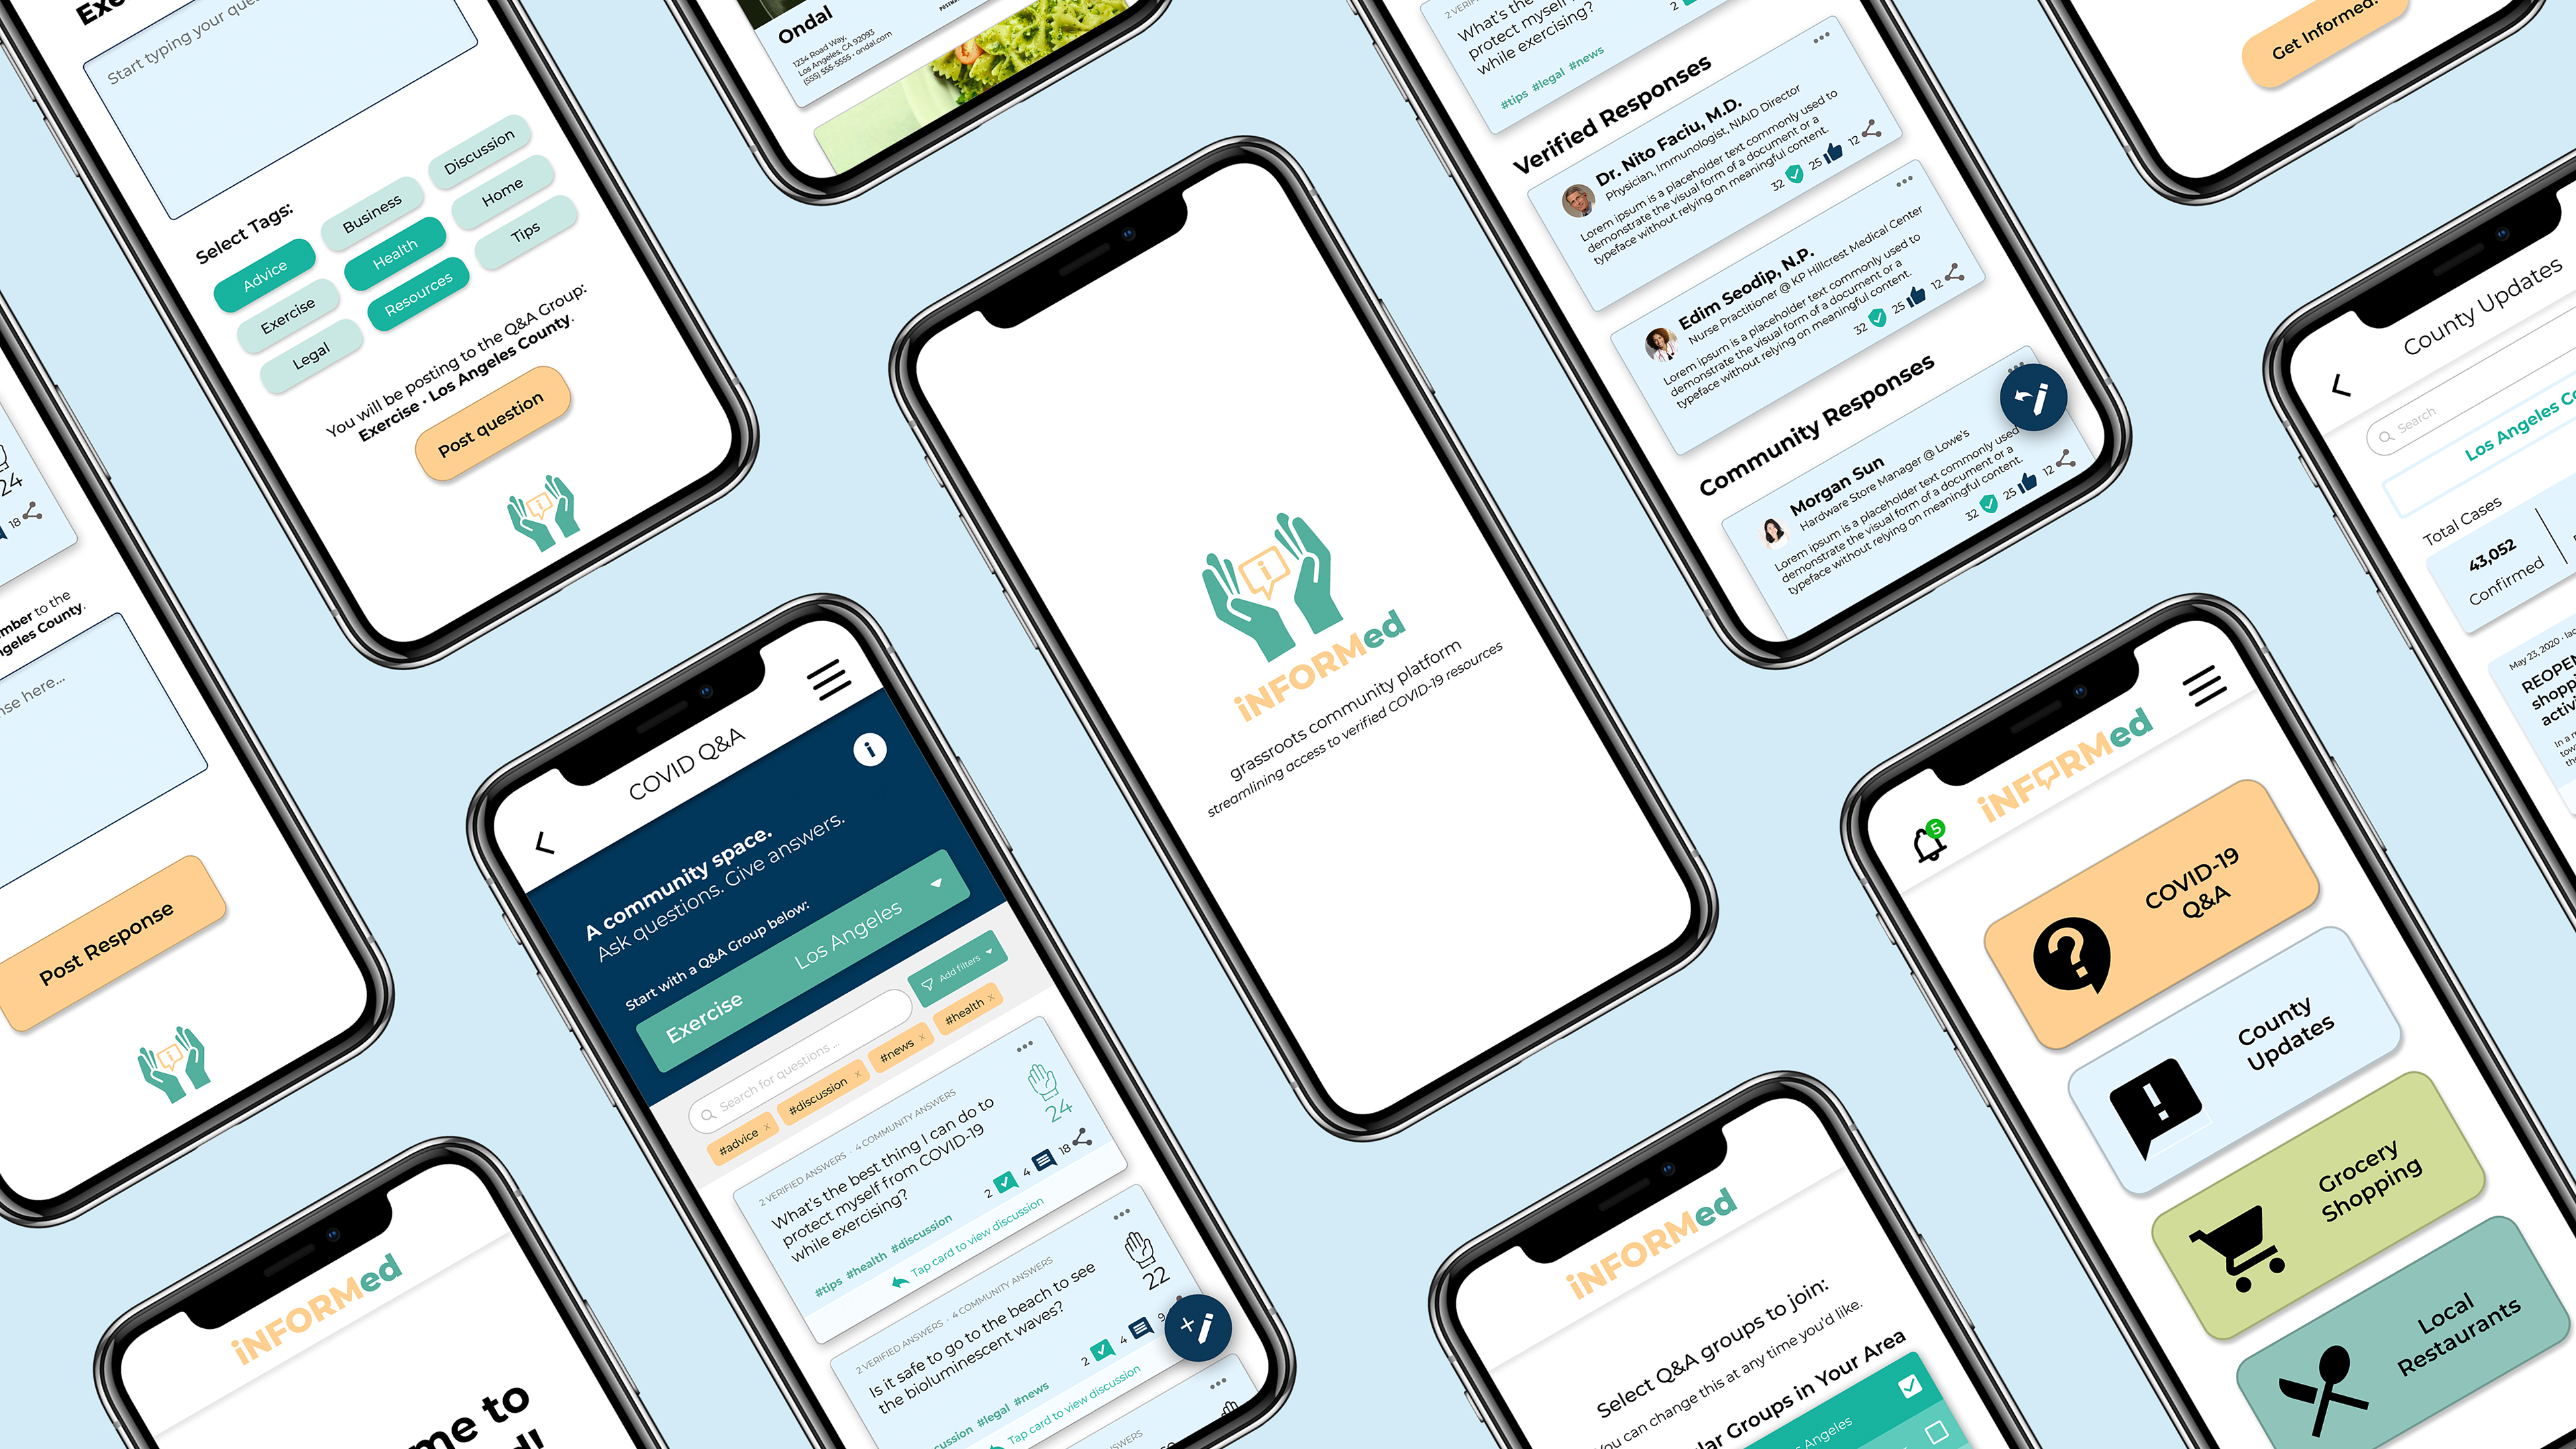
Overall, we consider the main highlight of our app to be the "COVID-19 Q&A" function, a forum where users can ask questions, write responses, and engage with the content and other users. Users who are medical professionals or other trusted experts can request to be verified in the app, and when viewing a certain question, Verified answers are shown before Community answers. We drew inspiration for this feature from apps and sites such as Reddit and Piazza. The idea is that iNFORMed is a completely grassroots platform that allows users to have streamlined access to verified COVID-19 information.
The other features in our app also provide important information and resources for users. For instance, "County Updates" is a place where users can view statistics and news for their specific county. In addition, "Grocery Shopping" and "Local Restaurants" shows updated store and restaurant hours. These features are community-based, so if a user submits a change in store hours, it requires approval of other users to be finalized. We drew inspiration for these sections from apps such as Yelp.
We chose the name iNFORMed (pronounced "in-for-med") because it is spelled like the word "informed," while incorporating a medical element, "med." Our mission is to give people the tools to stay informed with accurate, verified health information.
View our final design!
Designing iNFORMed with my team was a wonderful opportunity for me to get hands-on experience in UI/UX design. I really enjoyed developing a potential solution that proved to be impactful and relevant to the time we were (and still are) going through. I'd like to thank the rest of my team—Brianna Lui, Cora Xing, Josephine Reyes, and Sam Baik—for being so amazing to work with (completely remotely)! Overall, I learned so much from DSGN 100 and I am grateful for all the skills and experience I gained through this course.
Check out some of my other work!